Basic Stats
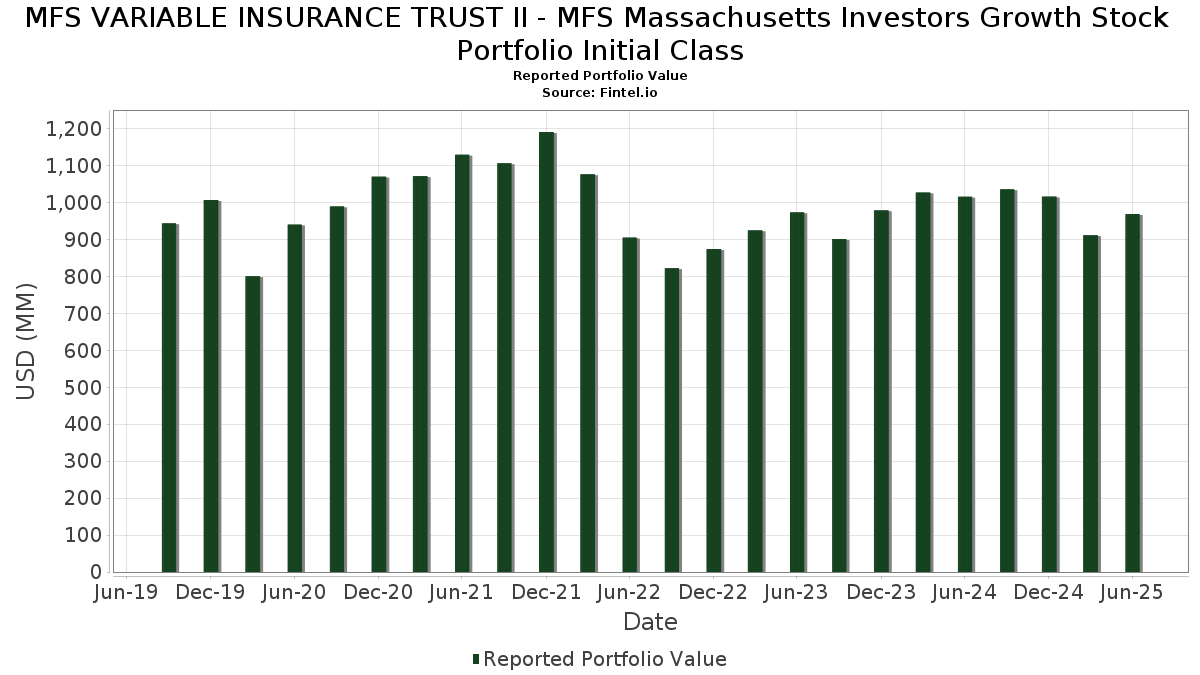
| Portfolio Value | $ 968,497,492 |
| Current Positions | 58 |
Latest Holdings, Performance, AUM (from 13F, 13D)
MFS VARIABLE INSURANCE TRUST II - MFS Massachusetts Investors Growth Stock Portfolio Initial Class has disclosed 58 total holdings in their latest SEC filings. Most recent portfolio value is calculated to be $ 968,497,492 USD. Actual Assets Under Management (AUM) is this value plus cash (which is not disclosed). MFS VARIABLE INSURANCE TRUST II - MFS Massachusetts Investors Growth Stock Portfolio Initial Class’s top holdings are Microsoft Corporation (US:MSFT) , NVIDIA Corporation (US:NVDA) , Apple Inc. (US:AAPL) , Visa Inc. (US:V) , and Accenture plc (US:ACN) . MFS VARIABLE INSURANCE TRUST II - MFS Massachusetts Investors Growth Stock Portfolio Initial Class’s new positions include JPMorgan Trust II - JPMorgan U.S. Government Money Market Fund IM (US:MGMXX) , .
Top Increases This Quarter
We use the change in the portfolio allocation because this is the most meaningful metric. Changes can be due to trades or changes in share prices.
| Security | Shares (MM) |
Value (MM$) |
Portfolio % | ΔPortfolio % |
|---|---|---|---|---|
| 0.29 | 144.92 | 15.0779 | 2.5244 | |
| 0.38 | 60.26 | 6.2694 | 1.6237 | |
| 7.35 | 7.35 | 0.7648 | 0.7648 | |
| 0.05 | 21.10 | 2.1954 | 0.6460 | |
| 0.09 | 19.31 | 2.0092 | 0.4185 | |
| 0.06 | 21.84 | 2.2718 | 0.4032 | |
| 0.22 | 21.72 | 2.2599 | 0.3993 | |
| 0.25 | 22.01 | 2.2898 | 0.3849 | |
| 0.02 | 9.39 | 0.9772 | 0.3444 | |
| 0.07 | 13.47 | 1.4011 | 0.2495 |
Top Decreases This Quarter
We use the change in the portfolio allocation because this is the most meaningful metric. Changes can be due to trades or changes in share prices.
| Security | Shares (MM) |
Value (MM$) |
Portfolio % | ΔPortfolio % |
|---|---|---|---|---|
| 0.22 | 44.56 | 4.6361 | -0.7858 | |
| 0.06 | 21.57 | 2.2444 | -0.6303 | |
| 0.22 | 20.67 | 2.1507 | -0.5104 | |
| 4.09 | 4.09 | 0.4254 | -0.4852 | |
| 0.07 | 11.82 | 1.2300 | -0.4718 | |
| 0.01 | 5.33 | 0.5550 | -0.4644 | |
| 0.09 | 6.38 | 0.6635 | -0.3919 | |
| 0.13 | 9.46 | 0.9839 | -0.3912 | |
| 0.09 | 28.06 | 2.9193 | -0.3728 | |
| 0.11 | 14.72 | 1.5316 | -0.3471 |
13F and Fund Filings
This form was filed on 2025-08-25 for the reporting period 2025-06-30. Click the link icon to see the full transaction history.
Upgrade to unlock premium data and export to Excel ![]() .
.
| Security | Type | Avg Share Price | Shares (MM) |
ΔShares (%) |
ΔShares (%) |
Value ($MM) |
Portfolio (%) |
ΔPortfolio (%) |
|
|---|---|---|---|---|---|---|---|---|---|
| MSFT / Microsoft Corporation | 0.29 | -4.41 | 144.92 | 26.66 | 15.0779 | 2.5244 | |||
| NVDA / NVIDIA Corporation | 0.38 | -2.38 | 60.26 | 42.31 | 6.2694 | 1.6237 | |||
| AAPL / Apple Inc. | 0.22 | -2.38 | 44.56 | -9.83 | 4.6361 | -0.7858 | |||
| V / Visa Inc. | 0.11 | -2.38 | 38.37 | -1.10 | 3.9927 | -0.2645 | |||
| ACN / Accenture plc | 0.09 | -2.38 | 28.06 | -6.49 | 2.9193 | -0.3728 | |||
| CRM / Salesforce, Inc. | 0.08 | 16.34 | 22.06 | 18.22 | 2.2956 | 0.2479 | |||
| TRU / TransUnion | 0.25 | 19.55 | 22.01 | 26.76 | 2.2898 | 0.3849 | |||
| ETN / Eaton Corporation plc | 0.06 | -2.37 | 21.84 | 28.21 | 2.2718 | 0.4032 | |||
| APH / Amphenol Corporation | 0.22 | -14.93 | 21.72 | 28.08 | 2.2599 | 0.3993 | |||
| GOOGL / Alphabet Inc. | 0.12 | -17.19 | 21.63 | -5.63 | 2.2501 | -0.2642 | |||
| AON / Aon plc | 0.06 | -7.90 | 21.57 | -17.67 | 2.2444 | -0.6303 | |||
| STE / STERIS plc | 0.09 | -2.38 | 21.23 | 3.47 | 2.2086 | -0.0423 | |||
| HUBB / Hubbell Incorporated | 0.05 | 21.07 | 21.10 | 49.42 | 2.1954 | 0.6460 | |||
| CHD / Church & Dwight Co., Inc. | 0.22 | -2.38 | 20.67 | -14.77 | 2.1507 | -0.5104 | |||
| TSM / Taiwan Semiconductor Manufacturing Company Limited - Depositary Receipt (Common Stock) | 0.09 | -2.38 | 19.31 | 33.19 | 2.0092 | 0.4185 | |||
| AMT / American Tower Corporation | 0.09 | -2.38 | 19.25 | -0.84 | 2.0030 | -0.1272 | |||
| CMS / CMS Energy Corporation | 0.28 | -2.38 | 19.23 | -9.95 | 2.0004 | -0.3423 | |||
| A / Agilent Technologies, Inc. | 0.15 | -2.38 | 17.84 | -1.52 | 1.8564 | -0.1314 | |||
| 700 / Tencent Holdings Limited | 0.26 | -2.36 | 16.43 | -1.83 | 1.7094 | -0.1269 | |||
| PEP / PepsiCo, Inc. | 0.11 | -2.38 | 14.72 | -14.03 | 1.5316 | -0.3471 | |||
| BDX / Becton, Dickinson and Company | 0.08 | 20.60 | 14.53 | -9.31 | 1.5118 | -0.2461 | |||
| DHR / Danaher Corporation | 0.07 | 33.15 | 13.47 | 28.31 | 1.4011 | 0.2495 | |||
| MA / Mastercard Incorporated | 0.02 | -2.38 | 13.34 | 0.08 | 1.3880 | -0.0745 | |||
| TE Connectivity PLC / EC (IE000IVNQZ81) | 0.08 | -2.37 | 13.31 | 16.53 | 1.3852 | 0.1315 | |||
| MCO / Moody's Corporation | 0.03 | -2.37 | 12.77 | 5.16 | 1.3284 | -0.0038 | |||
| DIS / The Walt Disney Company | 0.10 | -2.38 | 12.49 | 22.66 | 1.2996 | 0.1823 | |||
| HLT / Hilton Worldwide Holdings Inc. | 0.05 | -2.38 | 12.01 | 14.27 | 1.2501 | 0.0964 | |||
| EL / The Estée Lauder Companies Inc. | 0.15 | -2.38 | 12.01 | 19.52 | 1.2498 | 0.1471 | |||
| SCHW / The Charles Schwab Corporation | 0.13 | -2.38 | 11.91 | 13.78 | 1.2394 | 0.0908 | |||
| FI / Fiserv, Inc. | 0.07 | -2.38 | 11.82 | -23.78 | 1.2300 | -0.4718 | |||
| MKC / McCormick & Company, Incorporated | 0.15 | -2.38 | 11.70 | -10.07 | 1.2177 | -0.2102 | |||
| ROST / Ross Stores, Inc. | 0.09 | -2.38 | 11.52 | -2.54 | 1.1985 | -0.0982 | |||
| MMC / Marsh & McLennan Companies, Inc. | 0.05 | -2.38 | 11.01 | -12.53 | 1.1458 | -0.2356 | |||
| OTIS / Otis Worldwide Corporation | 0.11 | -2.38 | 10.77 | -6.33 | 1.1203 | -0.1409 | |||
| SHW / The Sherwin-Williams Company | 0.03 | -2.37 | 10.72 | -4.00 | 1.1156 | -0.1099 | |||
| BAM / Brookfield Asset Management Ltd. | 0.18 | -2.38 | 9.94 | 11.62 | 1.0344 | 0.0572 | |||
| MTD / Mettler-Toledo International Inc. | 0.01 | -2.38 | 9.94 | -2.88 | 1.0341 | -0.0888 | |||
| BSX / Boston Scientific Corporation | 0.09 | -24.02 | 9.91 | -19.11 | 1.0307 | -0.3129 | |||
| TJX / The TJX Companies, Inc. | 0.08 | -2.38 | 9.87 | -1.01 | 1.0270 | -0.0672 | |||
| NKE / NIKE, Inc. | 0.13 | -32.58 | 9.46 | -24.55 | 0.9839 | -0.3912 | |||
| LRLCY / L'Oréal S.A. - Depositary Receipt (Common Stock) | 0.02 | 3.00 | 9.39 | 57.33 | 0.9772 | 0.3444 | |||
| LVMUY / LVMH Moët Hennessy - Louis Vuitton, Société Européenne - Depositary Receipt (Common Stock) | 0.02 | -2.37 | 9.11 | -18.11 | 0.9483 | -0.2728 | |||
| SBGSY / Schneider Electric S.E. - Depositary Receipt (Common Stock) | 0.03 | -2.38 | 8.83 | 12.17 | 0.9186 | 0.0550 | |||
| POOL / Pool Corporation | 0.03 | 42.54 | 8.13 | 30.51 | 0.8456 | 0.1624 | |||
| CP / Canadian Pacific Kansas City Limited | 0.10 | -20.34 | 8.11 | -10.05 | 0.8433 | -0.1454 | |||
| CME / CME Group Inc. | 0.03 | -2.38 | 7.61 | 1.43 | 0.7914 | -0.0314 | |||
| MGMXX / JPMorgan Trust II - JPMorgan U.S. Government Money Market Fund IM | 7.35 | 7.35 | 0.7648 | 0.7648 | |||||
| TXN / Texas Instruments Incorporated | 0.03 | -2.38 | 6.71 | 12.79 | 0.6983 | 0.0454 | |||
| ADI / Analog Devices, Inc. | 0.03 | -32.60 | 6.59 | -20.45 | 0.6855 | -0.2232 | |||
| GGG / Graco Inc. | 0.08 | -2.38 | 6.49 | 0.51 | 0.6753 | -0.0333 | |||
| IJF / ICON Public Limited Company | 0.04 | -2.37 | 6.40 | -18.86 | 0.6657 | -0.1994 | |||
| Aptiv PLC / EC (JE00BTDN8H13) | 0.09 | -42.18 | 6.38 | -33.70 | 0.6635 | -0.3919 | |||
| IT / Gartner, Inc. | 0.01 | -40.38 | 5.33 | -42.59 | 0.5550 | -0.4644 | |||
| VEEV / Veeva Systems Inc. | 0.02 | -2.38 | 5.25 | 21.36 | 0.5463 | 0.0717 | |||
| TMO / Thermo Fisher Scientific Inc. | 0.01 | -2.37 | 5.05 | -20.46 | 0.5256 | -0.1712 | |||
| SYK / Stryker Corporation | 0.01 | -2.37 | 4.27 | 3.77 | 0.4441 | -0.0072 | |||
| SBUX / Starbucks Corporation | 0.05 | -2.38 | 4.13 | -8.79 | 0.4296 | -0.0672 | |||
| US55291X1090 / MFS Institutional Money Market Portfolio | 4.09 | -50.74 | 4.09 | -50.74 | 0.4254 | -0.4852 |