Basic Stats
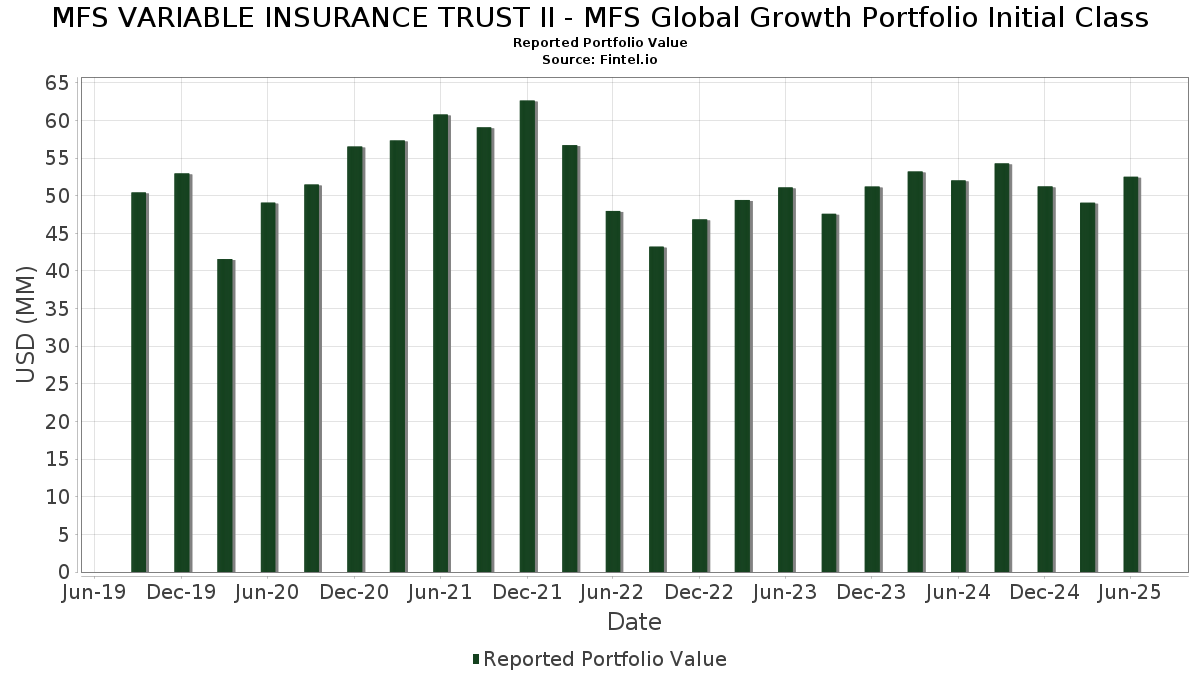
| Portfolio Value | $ 52,512,166 |
| Current Positions | 75 |
Latest Holdings, Performance, AUM (from 13F, 13D)
MFS VARIABLE INSURANCE TRUST II - MFS Global Growth Portfolio Initial Class has disclosed 75 total holdings in their latest SEC filings. Most recent portfolio value is calculated to be $ 52,512,166 USD. Actual Assets Under Management (AUM) is this value plus cash (which is not disclosed). MFS VARIABLE INSURANCE TRUST II - MFS Global Growth Portfolio Initial Class’s top holdings are Microsoft Corporation (US:MSFT) , Taiwan Semiconductor Manufacturing Company Limited - Depositary Receipt (Common Stock) (US:TSM) , Visa Inc. (US:V) , NVIDIA Corporation (US:NVDA) , and Tencent Holdings Limited (DE:NNND) . MFS VARIABLE INSURANCE TRUST II - MFS Global Growth Portfolio Initial Class’s new positions include JPMorgan Trust II - JPMorgan U.S. Government Money Market Fund IM (US:MGMXX) , .
Top Increases This Quarter
We use the change in the portfolio allocation because this is the most meaningful metric. Changes can be due to trades or changes in share prices.
| Security | Shares (MM) |
Value (MM$) |
Portfolio % | ΔPortfolio % |
|---|---|---|---|---|
| 0.79 | 0.79 | 1.5295 | 1.5295 | |
| 0.01 | 3.76 | 7.2760 | 1.3054 | |
| 1.05 | 1.05 | 2.0267 | 1.0389 | |
| 0.00 | 0.51 | 0.9784 | 0.9784 | |
| 0.01 | 1.90 | 3.6792 | 0.7475 | |
| 0.01 | 1.45 | 2.8014 | 0.7120 | |
| 0.00 | 0.94 | 1.8179 | 0.5927 | |
| 0.00 | 0.78 | 1.5112 | 0.3811 | |
| 0.01 | 1.09 | 2.1047 | 0.3791 | |
| 0.00 | 0.96 | 1.8603 | 0.3201 |
Top Decreases This Quarter
We use the change in the portfolio allocation because this is the most meaningful metric. Changes can be due to trades or changes in share prices.
| Security | Shares (MM) |
Value (MM$) |
Portfolio % | ΔPortfolio % |
|---|---|---|---|---|
| 0.00 | 0.93 | 1.8019 | -0.5547 | |
| 0.00 | 0.26 | 0.5034 | -0.4659 | |
| 0.00 | 0.61 | 1.1721 | -0.4599 | |
| 0.01 | 0.93 | 1.8043 | -0.4429 | |
| 0.00 | 0.28 | 0.5348 | -0.4072 | |
| 0.01 | 0.48 | 0.9236 | -0.4036 | |
| 0.00 | 0.66 | 1.2851 | -0.3802 | |
| 0.00 | 0.98 | 1.8892 | -0.3349 | |
| 0.00 | 0.48 | 0.9230 | -0.3205 | |
| 0.01 | 0.92 | 1.7810 | -0.3184 |
13F and Fund Filings
This form was filed on 2025-08-25 for the reporting period 2025-06-30. Click the link icon to see the full transaction history.
Upgrade to unlock premium data and export to Excel ![]() .
.
| Security | Type | Avg Share Price | Shares (MM) |
ΔShares (%) |
ΔShares (%) |
Value ($MM) |
Portfolio (%) |
ΔPortfolio (%) |
|
|---|---|---|---|---|---|---|---|---|---|
| MSFT / Microsoft Corporation | 0.01 | -2.11 | 3.76 | 29.68 | 7.2760 | 1.3054 | |||
| TSM / Taiwan Semiconductor Manufacturing Company Limited - Depositary Receipt (Common Stock) | 0.01 | -2.10 | 1.90 | 33.57 | 3.6792 | 0.7475 | |||
| V / Visa Inc. | 0.01 | -2.11 | 1.78 | -0.84 | 3.4354 | -0.2518 | |||
| NVDA / NVIDIA Corporation | 0.01 | -2.10 | 1.45 | 42.66 | 2.8014 | 0.7120 | |||
| NNND / Tencent Holdings Limited | 0.02 | -2.30 | 1.36 | -1.74 | 2.6267 | -0.2197 | |||
| HDFCB / HDFC Bank Ltd | 0.05 | -2.10 | 1.25 | 7.21 | 2.4169 | 0.0187 | |||
| ACN / Accenture plc | 0.00 | -2.11 | 1.21 | -6.22 | 2.3343 | -0.3155 | |||
| CRM / Salesforce, Inc. | 0.00 | 17.94 | 1.13 | 19.85 | 2.1835 | 0.2443 | |||
| STE / STERIS plc | 0.00 | -2.09 | 1.11 | 3.72 | 2.1553 | -0.0554 | |||
| TRU / TransUnion | 0.01 | 22.43 | 1.09 | 29.83 | 2.1047 | 0.3791 | |||
| US55291X1090 / MFS Institutional Money Market Portfolio | 1.05 | 118.39 | 1.05 | 118.79 | 2.0267 | 1.0389 | |||
| AAPL / Apple Inc. | 0.00 | -2.12 | 0.98 | -9.54 | 1.8892 | -0.3349 | |||
| SBGSY / Schneider Electric S.E. - Depositary Receipt (Common Stock) | 0.00 | -2.11 | 0.96 | 12.49 | 1.8644 | 0.1002 | |||
| ETN / Eaton Corporation plc | 0.00 | -2.11 | 0.96 | 28.61 | 1.8603 | 0.3201 | |||
| HUBB / Hubbell Incorporated | 0.00 | 27.96 | 0.94 | 57.98 | 1.8179 | 0.5927 | |||
| CHD / Church & Dwight Co., Inc. | 0.01 | -2.11 | 0.93 | -14.48 | 1.8043 | -0.4429 | |||
| AON / Aon plc | 0.00 | -8.96 | 0.93 | -18.62 | 1.8019 | -0.5547 | |||
| CMS / CMS Energy Corporation | 0.01 | -2.11 | 0.92 | -9.71 | 1.7810 | -0.3184 | |||
| A / Agilent Technologies, Inc. | 0.01 | -2.11 | 0.91 | -1.19 | 1.7602 | -0.1369 | |||
| AMT / American Tower Corporation | 0.00 | -2.09 | 0.90 | -0.55 | 1.7377 | -0.1222 | |||
| APH / Amphenol Corporation | 0.01 | -18.01 | 0.88 | 23.53 | 1.7055 | 0.2349 | |||
| CP / Canadian Pacific Kansas City Limited | 0.01 | -19.90 | 0.88 | -9.58 | 1.6983 | -0.3006 | |||
| 600519 / Kweichow Moutai Co., Ltd. | 0.00 | 0.00 | 0.83 | -8.63 | 1.5975 | -0.2632 | |||
| MGMXX / JPMorgan Trust II - JPMorgan U.S. Government Money Market Fund IM | 0.79 | 0.79 | 1.5295 | 1.5295 | |||||
| CAP / Capgemini SE | 0.00 | 24.56 | 0.78 | 42.26 | 1.5112 | 0.3811 | |||
| DHR / Danaher Corporation | 0.00 | 30.47 | 0.78 | 25.89 | 1.5046 | 0.2308 | |||
| GIB / CGI Inc. | 0.01 | -2.09 | 0.70 | 3.10 | 1.3516 | -0.0451 | |||
| BDX / Becton, Dickinson and Company | 0.00 | 24.30 | 0.70 | -6.58 | 1.3476 | -0.1869 | |||
| DIS / The Walt Disney Company | 0.01 | -2.10 | 0.69 | 22.94 | 1.3272 | 0.1787 | |||
| MC / LVMH Moët Hennessy - Louis Vuitton, Société Européenne | 0.00 | -2.08 | 0.66 | -17.92 | 1.2851 | -0.3802 | |||
| 6367 / Daikin Industries,Ltd. | 0.01 | 0.00 | 0.66 | 9.06 | 1.2802 | 0.0289 | |||
| MCO / Moody's Corporation | 0.00 | -2.09 | 0.66 | 5.61 | 1.2744 | -0.0118 | |||
| HLT / Hilton Worldwide Holdings Inc. | 0.00 | -2.10 | 0.65 | 14.54 | 1.2509 | 0.0890 | |||
| GOOGL / Alphabet Inc. | 0.00 | -2.11 | 0.63 | 11.50 | 1.2199 | 0.0560 | |||
| PEP / PepsiCo, Inc. | 0.00 | -2.12 | 0.63 | -13.87 | 1.2135 | -0.2850 | |||
| D8V / Credicorp Ltd. | 0.00 | -16.74 | 0.62 | 0.00 | 1.1950 | -0.0774 | |||
| FI / Fiserv, Inc. | 0.00 | -2.09 | 0.61 | -23.58 | 1.1721 | -0.4599 | |||
| EL / The Estée Lauder Companies Inc. | 0.01 | -2.10 | 0.60 | 19.88 | 1.1676 | 0.1307 | |||
| MTD / Mettler-Toledo International Inc. | 0.00 | -1.98 | 0.58 | -2.52 | 1.1221 | -0.1028 | |||
| OBL / OBIC Co.,Ltd. | 0.01 | -2.63 | 0.58 | 31.51 | 1.1151 | 0.2124 | |||
| MKC / McCormick & Company, Incorporated | 0.01 | -2.10 | 0.56 | -9.69 | 1.0811 | -0.1949 | |||
| TE Connectivity PLC / EC (IE000IVNQZ81) | 0.00 | -2.09 | 0.54 | 16.96 | 1.0407 | 0.0928 | |||
| SCHW / The Charles Schwab Corporation | 0.01 | -2.11 | 0.54 | 14.01 | 1.0398 | 0.0698 | |||
| OTIS / Otis Worldwide Corporation | 0.01 | -2.11 | 0.53 | -6.06 | 1.0192 | -0.1358 | |||
| WTKWY / Wolters Kluwer N.V. - Depositary Receipt (Common Stock) | 0.00 | -2.11 | 0.51 | 5.37 | 0.9881 | -0.0093 | |||
| OR / L'Oréal S.A. | 0.00 | 0.51 | 0.9784 | 0.9784 | |||||
| SHW / The Sherwin-Williams Company | 0.00 | -2.13 | 0.49 | -3.74 | 0.9461 | -0.1003 | |||
| BAM / Brookfield Asset Management Ltd. | 0.01 | -2.10 | 0.49 | 12.01 | 0.9380 | 0.0461 | |||
| NKE / NIKE, Inc. | 0.01 | -33.81 | 0.48 | -25.93 | 0.9236 | -0.4036 | |||
| BSX / Boston Scientific Corporation | 0.00 | -25.80 | 0.48 | -21.03 | 0.9230 | -0.3205 | |||
| ROST / Ross Stores, Inc. | 0.00 | -2.10 | 0.47 | -2.11 | 0.8992 | -0.0800 | |||
| TJX / The TJX Companies, Inc. | 0.00 | -2.11 | 0.46 | -0.65 | 0.8861 | -0.0642 | |||
| CLNX / Cellnex Telecom, S.A. | 0.01 | -2.10 | 0.45 | 7.11 | 0.8748 | 0.0049 | |||
| MA / Mastercard Incorporated | 0.00 | -2.21 | 0.45 | 0.22 | 0.8638 | -0.0533 | |||
| MMC / Marsh & McLennan Companies, Inc. | 0.00 | -2.11 | 0.44 | -12.30 | 0.8422 | -0.1799 | |||
| POOL / Pool Corporation | 0.00 | 43.20 | 0.43 | 30.91 | 0.8370 | 0.1575 | |||
| CME / CME Group Inc. | 0.00 | -2.07 | 0.40 | 1.76 | 0.7829 | -0.0361 | |||
| NESN / Nestlé S.A. | 0.00 | -2.11 | 0.39 | -3.74 | 0.7475 | -0.0798 | |||
| SYK / Stryker Corporation | 0.00 | -2.04 | 0.36 | 4.34 | 0.6984 | -0.0156 | |||
| GGG / Graco Inc. | 0.00 | -2.12 | 0.34 | 0.89 | 0.6603 | -0.0372 | |||
| SIKA / Sika AG | 0.00 | -2.04 | 0.33 | 9.76 | 0.6310 | 0.0193 | |||
| DLMAY / Dollarama Inc. - Depositary Receipt (Common Stock) | 0.00 | -28.27 | 0.32 | -5.62 | 0.6179 | -0.0780 | |||
| IJF / ICON Public Limited Company | 0.00 | -2.09 | 0.30 | -18.48 | 0.5802 | -0.1786 | |||
| TXN / Texas Instruments Incorporated | 0.00 | -2.15 | 0.29 | 13.18 | 0.5661 | 0.0331 | |||
| EXPN / Experian plc | 0.01 | -2.12 | 0.29 | 8.71 | 0.5567 | 0.0119 | |||
| VEEV / Veeva Systems Inc. | 0.00 | -2.10 | 0.28 | 22.08 | 0.5457 | 0.0685 | |||
| Aptiv PLC / EC (JE00BTDN8H13) | 0.00 | -47.30 | 0.28 | -39.61 | 0.5348 | -0.4072 | |||
| ADI / Analog Devices, Inc. | 0.00 | -38.29 | 0.27 | -27.17 | 0.5192 | -0.2396 | |||
| BME / B&M European Value Retail S.A. | 0.07 | -2.10 | 0.27 | 8.13 | 0.5148 | 0.0082 | |||
| IT / Gartner, Inc. | 0.00 | -42.60 | 0.26 | -44.68 | 0.5034 | -0.4659 | |||
| TMO / Thermo Fisher Scientific Inc. | 0.00 | -1.93 | 0.25 | -20.06 | 0.4782 | -0.1588 | |||
| BAER / Julius Bär Gruppe AG | 0.00 | -2.09 | 0.24 | -4.45 | 0.4582 | -0.0508 | |||
| SBUX / Starbucks Corporation | 0.00 | -2.13 | 0.18 | -8.29 | 0.3425 | -0.0562 | |||
| 035420 / NAVER Corporation | 0.00 | -64.99 | 0.16 | -47.99 | 0.3016 | -0.3135 | |||
| TRI / Thomson Reuters Corporation | 0.00 | -1.98 | 0.10 | 13.79 | 0.1925 | 0.0131 |