Basic Stats
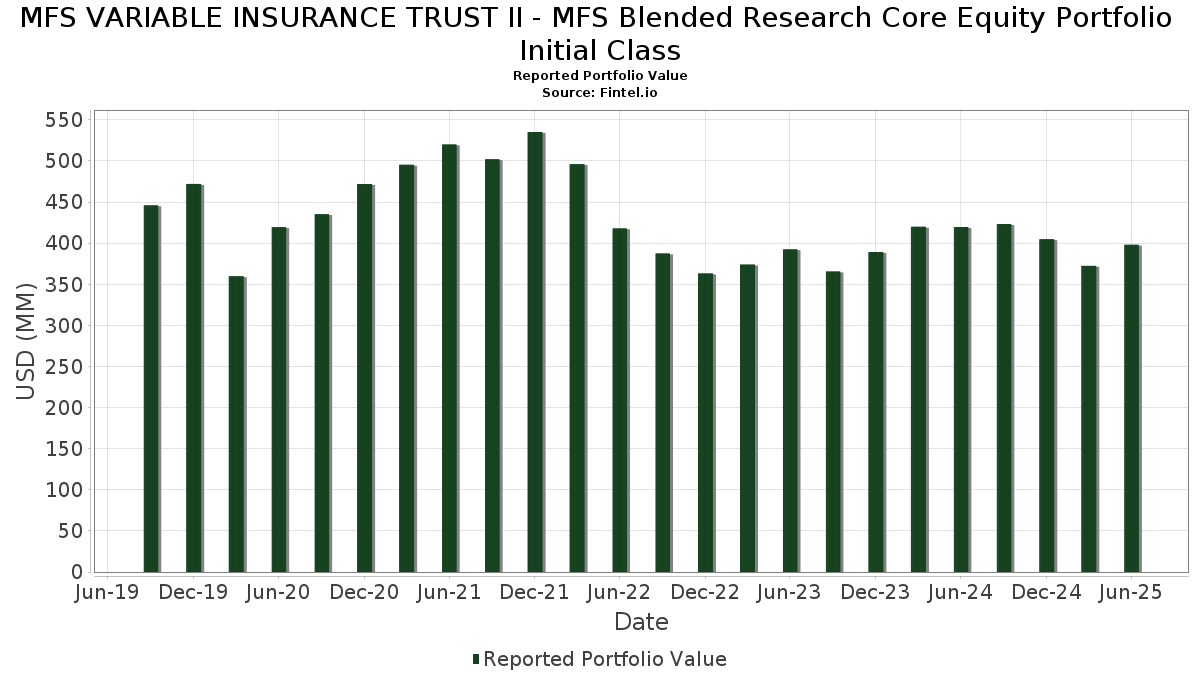
| Portfolio Value | $ 398,002,732 |
| Current Positions | 109 |
Latest Holdings, Performance, AUM (from 13F, 13D)
MFS VARIABLE INSURANCE TRUST II - MFS Blended Research Core Equity Portfolio Initial Class has disclosed 109 total holdings in their latest SEC filings. Most recent portfolio value is calculated to be $ 398,002,732 USD. Actual Assets Under Management (AUM) is this value plus cash (which is not disclosed). MFS VARIABLE INSURANCE TRUST II - MFS Blended Research Core Equity Portfolio Initial Class’s top holdings are NVIDIA Corporation (US:NVDA) , Microsoft Corporation (US:MSFT) , Apple Inc. (US:AAPL) , Amazon.com, Inc. (US:AMZN) , and Meta Platforms, Inc. (US:META) . MFS VARIABLE INSURANCE TRUST II - MFS Blended Research Core Equity Portfolio Initial Class’s new positions include Deere & Company (US:DE) , CRH plc (US:CRH) , Roblox Corporation (US:RBLX) , Ventas, Inc. (US:VTR) , and Palantir Technologies Inc. (US:PLTR) .
Top Increases This Quarter
We use the change in the portfolio allocation because this is the most meaningful metric. Changes can be due to trades or changes in share prices.
| Security | Shares (MM) |
Value (MM$) |
Portfolio % | ΔPortfolio % |
|---|---|---|---|---|
| 0.20 | 32.06 | 8.0541 | 1.9207 | |
| 0.01 | 7.00 | 1.7591 | 1.4537 | |
| 0.06 | 27.49 | 6.9067 | 0.8839 | |
| 0.02 | 6.71 | 1.6858 | 0.8191 | |
| 0.00 | 2.21 | 0.5555 | 0.5555 | |
| 0.01 | 2.56 | 0.6443 | 0.5263 | |
| 0.07 | 5.55 | 1.3953 | 0.5031 | |
| 0.01 | 3.24 | 0.8140 | 0.4132 | |
| 0.01 | 5.46 | 1.3728 | 0.3869 | |
| 0.06 | 3.24 | 0.8136 | 0.3402 |
Top Decreases This Quarter
We use the change in the portfolio allocation because this is the most meaningful metric. Changes can be due to trades or changes in share prices.
| Security | Shares (MM) |
Value (MM$) |
Portfolio % | ΔPortfolio % |
|---|---|---|---|---|
| 0.11 | 21.86 | 5.4935 | -1.1089 | |
| 0.02 | 0.82 | 0.2061 | -0.8756 | |
| 0.04 | 2.90 | 0.7296 | -0.5914 | |
| 0.04 | 6.54 | 1.6436 | -0.5634 | |
| 0.04 | 7.61 | 1.9112 | -0.4836 | |
| 0.02 | 1.43 | 0.3605 | -0.4825 | |
| 0.03 | 3.87 | 0.9713 | -0.4632 | |
| 0.05 | 1.81 | 0.4548 | -0.4120 | |
| 0.03 | 4.57 | 1.1474 | -0.3479 | |
| 0.04 | 6.71 | 1.6868 | -0.3462 |
13F and Fund Filings
This form was filed on 2025-08-25 for the reporting period 2025-06-30. Click the link icon to see the full transaction history.
Upgrade to unlock premium data and export to Excel ![]() .
.
| Security | Type | Avg Share Price | Shares (MM) |
ΔShares (%) |
ΔShares (%) |
Value ($MM) |
Portfolio (%) |
ΔPortfolio (%) |
|
|---|---|---|---|---|---|---|---|---|---|
| NVDA / NVIDIA Corporation | 0.20 | -3.76 | 32.06 | 40.30 | 8.0541 | 1.9207 | |||
| MSFT / Microsoft Corporation | 0.06 | -7.54 | 27.49 | 22.52 | 6.9067 | 0.8839 | |||
| AAPL / Apple Inc. | 0.11 | -3.76 | 21.86 | -11.11 | 5.4935 | -1.1089 | |||
| AMZN / Amazon.com, Inc. | 0.08 | -0.19 | 18.62 | 15.09 | 4.6774 | 0.3354 | |||
| META / Meta Platforms, Inc. | 0.02 | -16.42 | 16.38 | 7.04 | 4.1144 | 0.0076 | |||
| V / Visa Inc. | 0.03 | -3.76 | 8.96 | -2.50 | 2.2504 | -0.2156 | |||
| ABBV / AbbVie Inc. | 0.04 | -3.76 | 7.61 | -14.73 | 1.9112 | -0.4836 | |||
| NFLX / Netflix, Inc. | 0.01 | 328.52 | 7.00 | 515.66 | 1.7591 | 1.4537 | |||
| JNJ / Johnson & Johnson | 0.04 | -3.76 | 6.71 | -11.36 | 1.6868 | -0.3462 | |||
| AVGO / Broadcom Inc. | 0.02 | 26.23 | 6.71 | 107.84 | 1.6858 | 0.8191 | |||
| GOOGL / Alphabet Inc. | 0.04 | -30.18 | 6.54 | -20.44 | 1.6436 | -0.5634 | |||
| LRCX / Lam Research Corporation | 0.06 | -3.76 | 6.32 | 28.87 | 1.5880 | 0.2714 | |||
| CI / The Cigna Group | 0.02 | -3.76 | 6.18 | -3.30 | 1.5531 | -0.1628 | |||
| AMP / Ameriprise Financial, Inc. | 0.01 | -3.76 | 6.10 | 6.11 | 1.5319 | -0.0106 | |||
| NTRS / Northern Trust Corporation | 0.05 | -3.76 | 6.10 | 23.70 | 1.5317 | 0.2087 | |||
| SPF / Spotify Technology S.A. | 0.01 | -3.76 | 5.77 | 34.24 | 1.4503 | 0.2962 | |||
| CRM / Salesforce, Inc. | 0.02 | -3.76 | 5.59 | -2.20 | 1.4047 | -0.1299 | |||
| C / Citigroup Inc. | 0.07 | 39.34 | 5.55 | 67.11 | 1.3953 | 0.5031 | |||
| WAB / Westinghouse Air Brake Technologies Corporation | 0.03 | -3.76 | 5.47 | 11.10 | 1.3733 | 0.0527 | |||
| MCK / McKesson Corporation | 0.01 | 36.63 | 5.46 | 48.77 | 1.3728 | 0.3869 | |||
| VRSK / Verisk Analytics, Inc. | 0.02 | -3.76 | 5.37 | 0.73 | 1.3486 | -0.0818 | |||
| ORLY / O'Reilly Automotive, Inc. | 0.06 | 1,527.08 | 5.21 | 2.36 | 1.3103 | -0.0572 | |||
| MO / Altria Group, Inc. | 0.09 | -10.83 | 5.03 | -12.90 | 1.2627 | -0.2861 | |||
| AXP / American Express Company | 0.02 | -11.96 | 4.88 | 4.39 | 1.2250 | -0.0288 | |||
| BKNG / Booking Holdings Inc. | 0.00 | -3.55 | 4.72 | 21.22 | 1.1870 | 0.1407 | |||
| WFC / Wells Fargo & Company | 0.06 | -3.76 | 4.58 | 7.41 | 1.1516 | 0.0061 | |||
| QCOM / QUALCOMM Incorporated | 0.03 | -20.93 | 4.57 | -18.03 | 1.1474 | -0.3479 | |||
| GOOG / Alphabet Inc. | 0.03 | -20.59 | 4.45 | -9.83 | 1.1180 | -0.2067 | |||
| FTI / TechnipFMC plc | 0.13 | -3.76 | 4.31 | 4.61 | 1.0830 | -0.0232 | |||
| NOW / ServiceNow, Inc. | 0.00 | -3.78 | 4.09 | 24.24 | 1.0265 | 0.1439 | |||
| AMAT / Applied Materials, Inc. | 0.02 | -3.76 | 3.93 | 21.39 | 0.9868 | 0.1184 | |||
| KMB / Kimberly-Clark Corporation | 0.03 | -20.20 | 3.87 | -27.66 | 0.9713 | -0.4632 | |||
| PSX / Phillips 66 | 0.03 | -3.76 | 3.75 | -7.02 | 0.9419 | -0.1403 | |||
| PFE / Pfizer Inc. | 0.15 | -3.76 | 3.73 | -7.95 | 0.9369 | -0.1504 | |||
| PCG / PG&E Corporation | 0.25 | 68.11 | 3.46 | 36.42 | 0.8697 | 0.1885 | |||
| ARMK / Aramark | 0.08 | -3.76 | 3.34 | 16.72 | 0.8402 | 0.0712 | |||
| BLDR / Builders FirstSource, Inc. | 0.03 | -3.76 | 3.29 | -10.11 | 0.8263 | -0.1559 | |||
| MA / Mastercard Incorporated | 0.01 | 111.64 | 3.24 | 116.95 | 0.8140 | 0.4132 | |||
| EIX / Edison International | 0.06 | 109.66 | 3.24 | 83.66 | 0.8136 | 0.3402 | |||
| GWRE / Guidewire Software, Inc. | 0.01 | -3.77 | 3.23 | 20.93 | 0.8118 | 0.0946 | |||
| VRTX / Vertex Pharmaceuticals Incorporated | 0.01 | -3.77 | 3.08 | -11.64 | 0.7743 | -0.1618 | |||
| TSLA / Tesla, Inc. | 0.01 | -38.20 | 3.06 | -24.26 | 0.7682 | -0.3153 | |||
| BRK.B / Berkshire Hathaway Inc. | 0.01 | -11.56 | 3.05 | -19.33 | 0.7656 | -0.2484 | |||
| CL / Colgate-Palmolive Company | 0.03 | -3.76 | 2.96 | -6.62 | 0.7445 | -0.1074 | |||
| RPM / RPM International Inc. | 0.03 | -3.76 | 2.92 | -8.63 | 0.7341 | -0.1242 | |||
| LDOS / Leidos Holdings, Inc. | 0.02 | -3.77 | 2.91 | 12.47 | 0.7322 | 0.0369 | |||
| NEE / NextEra Energy, Inc. | 0.04 | -39.74 | 2.90 | -41.01 | 0.7296 | -0.5914 | |||
| GEV / GE Vernova Inc. | 0.01 | -3.77 | 2.86 | 66.84 | 0.7194 | 0.2586 | |||
| GE / General Electric Company | 0.01 | -17.05 | 2.86 | 6.68 | 0.7182 | -0.0011 | |||
| TE Connectivity PLC / EC (IE000IVNQZ81) | 0.02 | -3.75 | 2.86 | 14.88 | 0.7176 | 0.0502 | |||
| US55291X1090 / MFS Institutional Money Market Portfolio | 2.64 | 66.34 | 2.64 | 66.33 | 0.6642 | 0.2376 | |||
| EOG / EOG Resources, Inc. | 0.02 | -3.76 | 2.64 | -10.26 | 0.6638 | -0.1263 | |||
| BPOP / Popular, Inc. | 0.02 | -15.15 | 2.64 | 1.27 | 0.6636 | -0.0367 | |||
| BSX / Boston Scientific Corporation | 0.02 | -3.76 | 2.62 | 2.50 | 0.6593 | -0.0281 | |||
| WPC / W. P. Carey Inc. | 0.04 | -24.16 | 2.62 | -25.03 | 0.6586 | -0.2801 | |||
| PM / Philip Morris International Inc. | 0.01 | 408.30 | 2.56 | 484.05 | 0.6443 | 0.5263 | |||
| DE / Deere & Company | 0.00 | 2.21 | 0.5555 | 0.5555 | |||||
| EQH / Equitable Holdings, Inc. | 0.04 | 155.50 | 2.19 | 175.50 | 0.5510 | 0.3371 | |||
| JLL / Jones Lang LaSalle Incorporated | 0.01 | -31.60 | 2.12 | -29.41 | 0.5337 | -0.2742 | |||
| CUZ / Cousins Properties Incorporated | 0.07 | 52.30 | 2.08 | 55.00 | 0.5221 | 0.1623 | |||
| TGT / Target Corporation | 0.02 | -28.86 | 1.95 | -32.77 | 0.4909 | -0.2890 | |||
| MDT / Medtronic plc | 0.02 | -3.76 | 1.91 | -6.66 | 0.4794 | -0.0692 | |||
| HIG / The Hartford Insurance Group, Inc. | 0.01 | -3.75 | 1.90 | -1.30 | 0.4778 | -0.0394 | |||
| GDDY / GoDaddy Inc. | 0.01 | -3.77 | 1.86 | -3.78 | 0.4671 | -0.0517 | |||
| CNH / CNH Industrial N.V. | 0.14 | -3.76 | 1.85 | 1.59 | 0.4654 | -0.0241 | |||
| ETN / Eaton Corporation plc | 0.01 | -3.75 | 1.85 | 26.38 | 0.4648 | 0.0719 | |||
| US21871X1090 / Corebridge Financial, Inc. | 0.05 | -50.15 | 1.81 | -43.95 | 0.4548 | -0.4120 | |||
| JPM / JPMorgan Chase & Co. | 0.01 | -3.73 | 1.65 | 13.76 | 0.4154 | 0.0253 | |||
| HD / The Home Depot, Inc. | 0.00 | -3.74 | 1.63 | -3.72 | 0.4097 | -0.0449 | |||
| OKTA / Okta, Inc. | 0.02 | 176.78 | 1.56 | 163.18 | 0.3916 | 0.2325 | |||
| MDLZ / Mondelez International, Inc. | 0.02 | -3.76 | 1.50 | -4.28 | 0.3764 | -0.0440 | |||
| COP / ConocoPhillips | 0.02 | -46.53 | 1.43 | -54.33 | 0.3605 | -0.4825 | |||
| RJF / Raymond James Financial, Inc. | 0.01 | -31.52 | 1.43 | -24.41 | 0.3597 | -0.1486 | |||
| CSX / CSX Corporation | 0.04 | -3.76 | 1.42 | 6.71 | 0.3559 | -0.0004 | |||
| ZM / Zoom Communications Inc. | 0.02 | 243.40 | 1.30 | 263.23 | 0.3279 | 0.2314 | |||
| EMN / Eastman Chemical Company | 0.02 | -3.76 | 1.30 | -18.47 | 0.3262 | -0.1012 | |||
| ESS / Essex Property Trust, Inc. | 0.00 | -32.60 | 1.28 | -37.68 | 0.3204 | -0.2291 | |||
| CRH / CRH plc | 0.01 | 1.17 | 0.2952 | 0.2952 | |||||
| TMUS / T-Mobile US, Inc. | 0.00 | -3.74 | 1.14 | -13.95 | 0.2867 | -0.0695 | |||
| AEE / Ameren Corporation | 0.01 | -3.76 | 1.12 | -7.89 | 0.2815 | -0.0452 | |||
| VFC / V.F. Corporation | 0.09 | -23.82 | 1.08 | -42.33 | 0.2702 | -0.2303 | |||
| HUM / Humana Inc. | 0.00 | 175.74 | 1.00 | 154.99 | 0.2507 | 0.1456 | |||
| DBX / Dropbox, Inc. | 0.03 | -3.76 | 0.95 | 3.04 | 0.2384 | -0.0088 | |||
| MAS / Masco Corporation | 0.01 | -38.92 | 0.93 | -43.47 | 0.2340 | -0.2083 | |||
| Aptiv PLC / EC (JE00BTDN8H13) | 0.01 | -3.76 | 0.92 | 10.41 | 0.2320 | 0.0074 | |||
| APH / Amphenol Corporation | 0.01 | -3.75 | 0.87 | 44.91 | 0.2182 | 0.0573 | |||
| SYF / Synchrony Financial | 0.01 | -3.76 | 0.85 | 21.29 | 0.2135 | 0.0255 | |||
| GIS / General Mills, Inc. | 0.02 | -76.50 | 0.82 | -79.65 | 0.2061 | -0.8756 | |||
| UAL / United Airlines Holdings, Inc. | 0.01 | -29.97 | 0.81 | -19.33 | 0.2047 | -0.0661 | |||
| RBLX / Roblox Corporation | 0.01 | 0.80 | 0.2009 | 0.2009 | |||||
| DG / Dollar General Corporation | 0.01 | -45.08 | 0.77 | -69.00 | 0.1940 | -0.3087 | |||
| MET / MetLife, Inc. | 0.01 | -3.76 | 0.74 | -3.51 | 0.1865 | -0.0202 | |||
| PFG / Principal Financial Group, Inc. | 0.01 | -3.76 | 0.71 | -9.39 | 0.1796 | -0.0322 | |||
| MSI / Motorola Solutions, Inc. | 0.00 | -36.87 | 0.70 | -39.41 | 0.1771 | -0.1350 | |||
| VTR / Ventas, Inc. | 0.01 | 0.63 | 0.1586 | 0.1586 | |||||
| LLY / Eli Lilly and Company | 0.00 | -39.31 | 0.63 | -42.73 | 0.1585 | -0.1371 | |||
| NRG / NRG Energy, Inc. | 0.00 | -3.79 | 0.61 | 61.87 | 0.1526 | 0.0518 | |||
| INGR / Ingredion Incorporated | 0.00 | -81.81 | 0.52 | -67.45 | 0.1319 | -0.2378 | |||
| PLTR / Palantir Technologies Inc. | 0.00 | 0.51 | 0.1272 | 0.1272 | |||||
| CB / Chubb Limited | 0.00 | -3.69 | 0.44 | -7.59 | 0.1102 | -0.0172 | |||
| MHK / Mohawk Industries, Inc. | 0.00 | -3.78 | 0.44 | -11.59 | 0.1094 | -0.0229 | |||
| EAT / Brinker International, Inc. | 0.00 | -3.73 | 0.42 | 16.53 | 0.1065 | 0.0088 | |||
| EPRT / Essential Properties Realty Trust, Inc. | 0.01 | -3.77 | 0.36 | -5.97 | 0.0912 | -0.0124 | |||
| SPG / Simon Property Group, Inc. | 0.00 | -3.75 | 0.36 | -7.01 | 0.0902 | -0.0132 | |||
| EG / Everest Group, Ltd. | 0.00 | -3.93 | 0.34 | -10.05 | 0.0855 | -0.0162 | |||
| XOM / Exxon Mobil Corporation | 0.00 | -3.77 | 0.31 | -12.86 | 0.0767 | -0.0173 | |||
| OGN / Organon & Co. | 0.03 | -3.76 | 0.29 | -37.53 | 0.0725 | -0.0513 | |||
| IQV / IQVIA Holdings Inc. | 0.00 | -3.80 | 0.29 | -14.11 | 0.0721 | -0.0175 | |||
| PEP / PepsiCo, Inc. | 0.00 | -3.74 | 0.27 | -15.43 | 0.0691 | -0.0180 |