Basic Stats
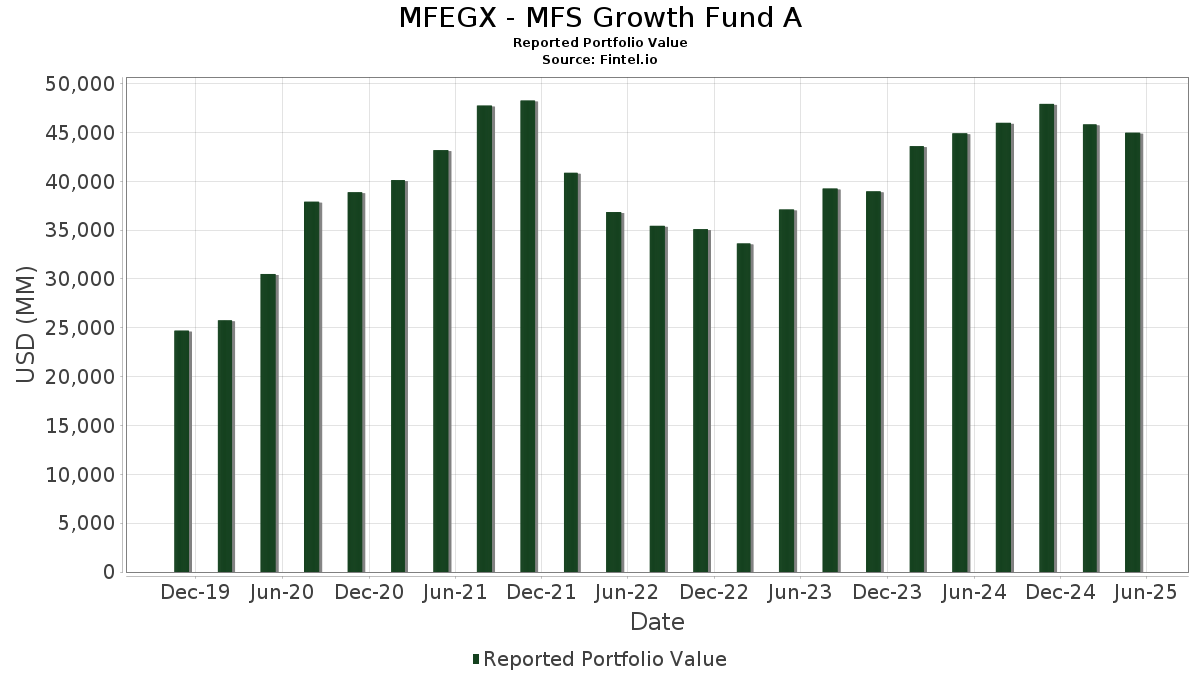
| Portfolio Value | $ 44,967,126,172 |
| Current Positions | 73 |
Latest Holdings, Performance, AUM (from 13F, 13D)
MFEGX - MFS Growth Fund A has disclosed 73 total holdings in their latest SEC filings. Most recent portfolio value is calculated to be $ 44,967,126,172 USD. Actual Assets Under Management (AUM) is this value plus cash (which is not disclosed). MFEGX - MFS Growth Fund A’s top holdings are Microsoft Corporation (US:MSFT) , NVIDIA Corporation (US:NVDA) , Amazon.com, Inc. (US:AMZN) , Meta Platforms, Inc. (US:META) , and Apple Inc. (US:AAPL) . MFEGX - MFS Growth Fund A’s new positions include Nasdaq, Inc. (US:NDAQ) , The Cigna Group (US:CI) , DexCom, Inc. (US:DXCM) , SAP SE (US:SAPGF) , and LPL Financial Holdings Inc. (US:LPLA) .
Top Increases This Quarter
We use the change in the portfolio allocation because this is the most meaningful metric. Changes can be due to trades or changes in share prices.
| Security | Shares (MM) |
Value (MM$) |
Portfolio % | ΔPortfolio % |
|---|---|---|---|---|
| 12.09 | 5,566.53 | 12.3918 | 1.9125 | |
| 1.09 | 1,309.93 | 2.9161 | 0.9576 | |
| 4.60 | 830.66 | 1.8492 | 0.6604 | |
| 1.39 | 659.43 | 1.4680 | 0.5845 | |
| 2.91 | 243.24 | 0.5415 | 0.5415 | |
| 8.96 | 805.82 | 1.7939 | 0.5027 | |
| 4.50 | 764.17 | 1.7011 | 0.3598 | |
| 0.48 | 153.46 | 0.3416 | 0.3416 | |
| 2.92 | 244.74 | 0.5448 | 0.2985 | |
| 3.08 | 1,804.31 | 4.0166 | 0.2884 |
Top Decreases This Quarter
We use the change in the portfolio allocation because this is the most meaningful metric. Changes can be due to trades or changes in share prices.
| Security | Shares (MM) |
Value (MM$) |
Portfolio % | ΔPortfolio % |
|---|---|---|---|---|
| 10.95 | 2,199.14 | 4.8956 | -0.8851 | |
| 0.14 | 103.36 | 0.2301 | -0.8597 | |
| 4.80 | 3,105.37 | 6.9130 | -0.5444 | |
| 0.43 | 190.12 | 0.4232 | -0.5222 | |
| 0.32 | 141.83 | 0.3157 | -0.4625 | |
| 1.29 | 209.78 | 0.4670 | -0.3831 | |
| 1.01 | 269.35 | 0.5996 | -0.3731 | |
| 1.72 | 426.92 | 0.9504 | -0.3664 | |
| 385.00 | 385.00 | 0.8571 | -0.3532 | |
| 0.88 | 356.38 | 0.7934 | -0.3310 |
13F and Fund Filings
This form was filed on 2025-07-25 for the reporting period 2025-05-31. Click the link icon to see the full transaction history.
Upgrade to unlock premium data and export to Excel ![]() .
.
| Security | Type | Avg Share Price | Shares (MM) |
ΔShares (%) |
ΔShares (%) |
Value ($MM) |
Portfolio (%) |
ΔPortfolio (%) |
|
|---|---|---|---|---|---|---|---|---|---|
| MSFT / Microsoft Corporation | 12.09 | -0.10 | 5,566.53 | 15.85 | 12.3918 | 1.9125 | |||
| NVDA / NVIDIA Corporation | 26.97 | -6.88 | 3,645.10 | 0.73 | 8.1145 | 0.2223 | |||
| AMZN / Amazon.com, Inc. | 16.61 | -0.10 | 3,405.78 | -3.52 | 7.5817 | -0.1170 | |||
| META / Meta Platforms, Inc. | 4.80 | -6.28 | 3,105.37 | -9.18 | 6.9130 | -0.5444 | |||
| AAPL / Apple Inc. | 10.95 | -0.10 | 2,199.14 | -17.03 | 4.8956 | -0.8851 | |||
| GOOGL / Alphabet Inc. | 12.42 | -9.15 | 2,132.38 | -8.38 | 4.7470 | -0.3286 | |||
| MA / Mastercard Incorporated | 3.08 | 3.87 | 1,804.31 | 5.55 | 4.0166 | 0.2884 | |||
| NFLX / Netflix, Inc. | 1.09 | 18.48 | 1,309.93 | 45.87 | 2.9161 | 0.9576 | |||
| V / Visa Inc. | 2.46 | 5.31 | 897.97 | 6.03 | 1.9990 | 0.1520 | |||
| SPOT / Spotify Technology S.A. | 1.30 | -0.10 | 862.40 | 9.29 | 1.9198 | 0.1988 | |||
| PM / Philip Morris International Inc. | 4.60 | 31.03 | 830.66 | 52.39 | 1.8492 | 0.6604 | |||
| APH / Amphenol Corporation | 8.96 | 0.80 | 805.82 | 36.11 | 1.7939 | 0.5027 | |||
| HWM / Howmet Aerospace Inc. | 4.50 | -0.10 | 764.17 | 24.25 | 1.7011 | 0.3598 | |||
| BSX / Boston Scientific Corporation | 7.25 | -8.16 | 763.02 | -6.86 | 1.6986 | -0.0881 | |||
| KKR / KKR & Co. Inc. | 5.50 | -3.92 | 667.64 | -13.93 | 1.4863 | -0.2055 | |||
| GEV / GE Vernova Inc. | 1.39 | 15.36 | 659.43 | 62.79 | 1.4680 | 0.5845 | |||
| ADSK / Autodesk, Inc. | 2.16 | 3.80 | 640.12 | 12.10 | 1.4250 | 0.1796 | |||
| ETN / Eaton Corporation plc | 1.97 | 7.12 | 631.18 | 16.94 | 1.4051 | 0.2280 | |||
| GE / General Electric Company | 2.16 | 4.97 | 530.24 | 24.71 | 1.1804 | 0.2531 | |||
| VRSK / Verisk Analytics, Inc. | 1.55 | -4.48 | 485.57 | 1.06 | 1.0810 | 0.0331 | |||
| ISRG / Intuitive Surgical, Inc. | 0.86 | 11.32 | 472.99 | 7.28 | 1.0529 | 0.0914 | |||
| LIN / Linde plc | 1.00 | -0.10 | 468.80 | 0.01 | 1.0436 | 0.0213 | |||
| LNG / Cheniere Energy, Inc. | 1.96 | -0.10 | 463.40 | 3.59 | 1.0316 | 0.0559 | |||
| VMC / Vulcan Materials Company | 1.74 | -9.66 | 460.62 | -3.18 | 1.0254 | -0.0121 | |||
| TTWO / Take-Two Interactive Software, Inc. | 1.92 | 5.12 | 434.40 | 12.21 | 0.9670 | 0.1228 | |||
| HLT / Hilton Worldwide Holdings Inc. | 1.72 | -24.59 | 426.92 | -29.29 | 0.9504 | -0.3664 | |||
| TRU / TransUnion | 4.91 | -0.10 | 420.54 | -7.45 | 0.9362 | -0.0548 | |||
| TEAM / Atlassian Corporation | 1.98 | 4.04 | 410.59 | -24.00 | 0.9140 | -0.2643 | |||
| TT / Trane Technologies plc | 0.94 | 13.68 | 406.31 | 38.29 | 0.9045 | 0.2637 | |||
| US55291X1090 / MFS Institutional Money Market Portfolio | 385.00 | -30.62 | 385.00 | -30.62 | 0.8571 | -0.3532 | |||
| NOW / ServiceNow, Inc. | 0.37 | -29.70 | 372.15 | -23.55 | 0.8285 | -0.2332 | |||
| CDNS / Cadence Design Systems, Inc. | 1.29 | 20.09 | 371.37 | 37.62 | 0.8267 | 0.2382 | |||
| AJG / Arthur J. Gallagher & Co. | 1.05 | -0.10 | 364.75 | 2.77 | 0.8120 | 0.0379 | |||
| TMO / Thermo Fisher Scientific Inc. | 0.88 | -9.23 | 356.38 | -30.87 | 0.7934 | -0.3310 | |||
| ORLY / O'Reilly Automotive, Inc. | 0.25 | 25.33 | 337.10 | 24.77 | 0.7504 | 0.1612 | |||
| ARES / Ares Management Corporation | 1.95 | -14.12 | 321.94 | -16.85 | 0.7167 | -0.1277 | |||
| ASML / ASML Holding N.V. - Depositary Receipt (Common Stock) | 0.44 | 15.59 | 320.89 | 20.10 | 0.7143 | 0.1317 | |||
| ABT / Abbott Laboratories | 2.27 | 54.70 | 303.20 | 49.74 | 0.6750 | 0.2334 | |||
| TSM / Taiwan Semiconductor Manufacturing Company Limited - Depositary Receipt (Common Stock) | 1.44 | -14.62 | 279.15 | -8.57 | 0.6214 | -0.0445 | |||
| CRM / Salesforce, Inc. | 1.01 | -32.22 | 269.35 | -39.61 | 0.5996 | -0.3731 | |||
| MCO / Moody's Corporation | 0.56 | 71.09 | 268.14 | 62.74 | 0.5969 | 0.2376 | |||
| MDT / Medtronic plc | 3.22 | 104.66 | 266.85 | 84.55 | 0.5940 | 0.2787 | |||
| KLAC / KLA Corporation | 0.35 | 31.65 | 263.77 | 40.58 | 0.5872 | 0.1780 | |||
| GWRE / Guidewire Software, Inc. | 1.14 | 40.62 | 245.87 | 50.19 | 0.5473 | 0.1903 | |||
| SBUX / Starbucks Corporation | 2.92 | 151.85 | 244.74 | 169.33 | 0.5448 | 0.2985 | |||
| NDAQ / Nasdaq, Inc. | 2.91 | 243.24 | 0.5415 | 0.5415 | |||||
| VST / Vistra Corp. | 1.46 | -42.91 | 234.78 | -31.42 | 0.5227 | -0.2240 | |||
| VEEV / Veeva Systems Inc. | 0.83 | -0.10 | 233.12 | 24.66 | 0.5190 | 0.1111 | |||
| CRWD / CrowdStrike Holdings, Inc. | 0.49 | 76.97 | 232.42 | 114.08 | 0.5174 | 0.2806 | |||
| AVGO / Broadcom Inc. | 0.90 | -13.17 | 217.80 | 5.40 | 0.4848 | 0.0342 | |||
| FI / Fiserv, Inc. | 1.29 | -22.08 | 209.78 | -46.18 | 0.4670 | -0.3831 | |||
| APO / Apollo Global Management, Inc. | 1.54 | -18.42 | 200.65 | -28.58 | 0.4467 | -0.1660 | |||
| LVMUY / LVMH Moët Hennessy - Louis Vuitton, Société Européenne - Depositary Receipt (Common Stock) | 0.35 | -21.22 | 192.46 | -41.12 | 0.4284 | -0.2845 | |||
| VRTX / Vertex Pharmaceuticals Incorporated | 0.43 | -52.40 | 190.12 | -56.14 | 0.4232 | -0.5222 | |||
| ROP / Roper Technologies, Inc. | 0.33 | 26.51 | 189.10 | 79.20 | 0.4210 | 0.1235 | |||
| CSGP / CoStar Group, Inc. | 2.50 | -9.85 | 183.80 | -13.03 | 0.4092 | -0.0518 | |||
| CMG / Chipotle Mexican Grill, Inc. | 3.58 | -0.10 | 179.14 | -7.30 | 0.3988 | -0.0227 | |||
| SHOP / Shopify Inc. | 1.56 | -29.95 | 167.58 | -32.94 | 0.3730 | -0.1719 | |||
| CBRE / CBRE Group, Inc. | 1.32 | 32.35 | 164.52 | 16.57 | 0.3662 | 0.0585 | |||
| CI / The Cigna Group | 0.48 | 153.46 | 0.3416 | 0.3416 | |||||
| APP / AppLovin Corporation | 0.38 | 49.29 | 147.78 | 80.11 | 0.3290 | 0.1500 | |||
| IT / Gartner, Inc. | 0.32 | -54.61 | 141.83 | -60.25 | 0.3157 | -0.4625 | |||
| DDOG / Datadog, Inc. | 1.18 | -15.80 | 138.65 | -14.84 | 0.3087 | -0.0464 | |||
| DXCM / DexCom, Inc. | 1.31 | 112.17 | 0.2497 | 0.2497 | |||||
| SNPS / Synopsys, Inc. | 0.23 | -51.30 | 107.33 | -50.59 | 0.2389 | -0.2348 | |||
| MSCI / MSCI Inc. | 0.19 | -43.64 | 106.34 | -46.17 | 0.2367 | -0.1941 | |||
| LLY / Eli Lilly and Company | 0.14 | -74.19 | 103.36 | -79.32 | 0.2301 | -0.8597 | |||
| DHR / Danaher Corporation | 0.48 | -52.25 | 90.83 | -56.36 | 0.2022 | -0.2517 | |||
| GS / The Goldman Sachs Group, Inc. | 0.15 | -60.99 | 89.92 | -62.36 | 0.2002 | -0.3208 | |||
| SAPGF / SAP SE | 0.27 | 81.00 | 0.1803 | 0.1803 | |||||
| HUBS / HubSpot, Inc. | 0.12 | 102.68 | 73.59 | 65.14 | 0.1638 | 0.0666 | |||
| NEE / NextEra Energy, Inc. | 1.03 | -0.10 | 72.97 | 0.57 | 0.1624 | 0.0042 | |||
| LPLA / LPL Financial Holdings Inc. | 0.17 | 67.42 | 0.1501 | 0.1501 |