Basic Stats
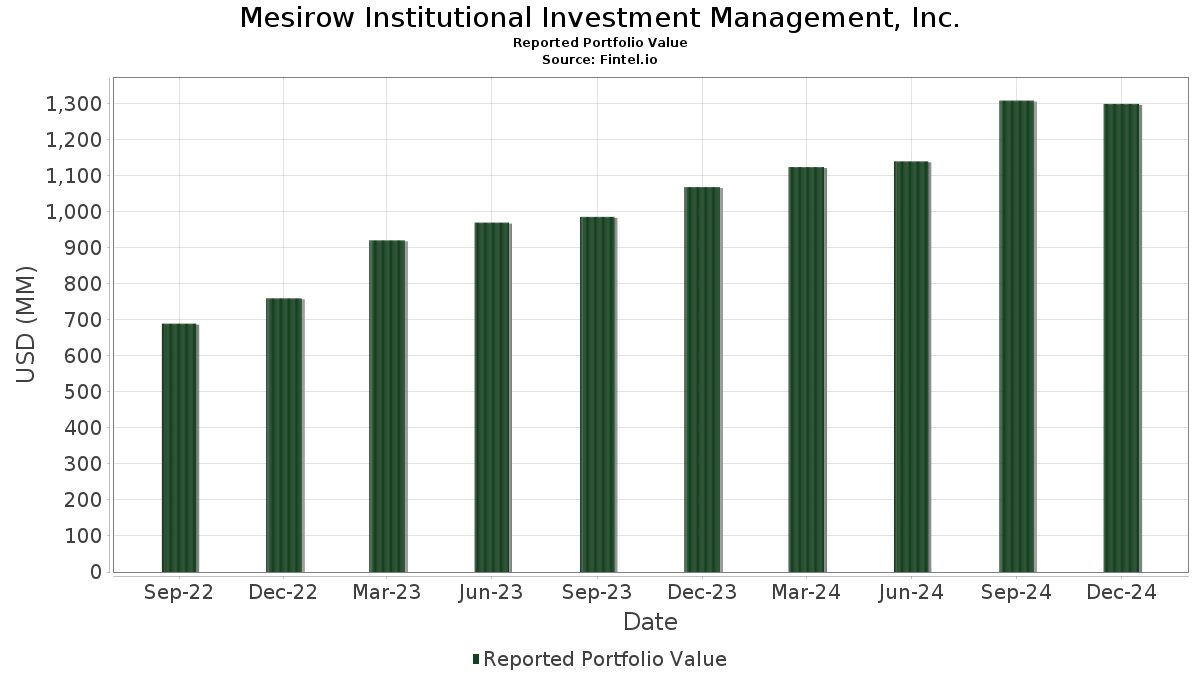
| Portfolio Value | $ 1,299,904,834 |
| Current Positions | 131 |
Latest Holdings, Performance, AUM (from 13F, 13D)
Mesirow Institutional Investment Management, Inc. has disclosed 131 total holdings in their latest SEC filings. Most recent portfolio value is calculated to be $ 1,299,904,834 USD. Actual Assets Under Management (AUM) is this value plus cash (which is not disclosed). Mesirow Institutional Investment Management, Inc.’s top holdings are Kyndryl Holdings, Inc. (US:KD) , Fluor Corporation (US:FLR) , Mercury Systems, Inc. (US:MRCY) , e.l.f. Beauty, Inc. (US:ELF) , and Prosperity Bancshares, Inc. (US:PB) . Mesirow Institutional Investment Management, Inc.’s new positions include Xenia Hotels & Resorts, Inc. (US:XHR) , First Watch Restaurant Group, Inc. (US:FWRG) , WNS (Holdings) Limited (US:WNS) , Allegiant Travel Company (US:ALGT) , and Pegasystems Inc. (US:PEGA) .
Top Increases This Quarter
We use the change in the portfolio allocation because this is the most meaningful metric. Changes can be due to trades or changes in share prices.
| Security | Shares (MM) |
Value (MM$) |
Portfolio % | ΔPortfolio % |
|---|---|---|---|---|
| 1.08 | 15.98 | 1.2295 | 1.2295 | |
| 0.49 | 15.73 | 1.2104 | 1.2104 | |
| 0.83 | 15.51 | 1.1928 | 1.1928 | |
| 0.29 | 14.99 | 1.1532 | 1.1532 | |
| 0.30 | 14.18 | 1.0909 | 1.0909 | |
| 0.15 | 13.83 | 1.0640 | 1.0640 | |
| 0.15 | 13.80 | 1.0617 | 1.0617 | |
| 0.63 | 13.55 | 1.0423 | 1.0423 | |
| 1.00 | 10.88 | 0.8374 | 0.8374 | |
| 0.38 | 10.84 | 0.8338 | 0.8338 |
Top Decreases This Quarter
We use the change in the portfolio allocation because this is the most meaningful metric. Changes can be due to trades or changes in share prices.
| Security | Shares (MM) |
Value (MM$) |
Portfolio % | ΔPortfolio % |
|---|---|---|---|---|
| 0.00 | 0.00 | -1.0500 | ||
| 0.00 | 0.36 | 0.0280 | -0.9904 | |
| 0.00 | 0.00 | -0.9333 | ||
| 0.00 | 0.00 | -0.9118 | ||
| 0.00 | 0.02 | 0.0017 | -0.8358 | |
| 0.00 | 0.00 | -0.8190 | ||
| 0.49 | 5.80 | 0.4465 | -0.5625 | |
| 0.06 | 7.78 | 0.5986 | -0.4980 | |
| 0.78 | 13.42 | 1.0323 | -0.4976 | |
| 1.18 | 11.87 | 0.9129 | -0.4687 |
13F and Fund Filings
This form was filed on 2025-02-13 for the reporting period 2024-12-31. Click the link icon to see the full transaction history.
Upgrade to unlock premium data and export to Excel ![]() .
.
| Security | Type | Avg Share Price | Shares (MM) |
ΔShares (%) |
ΔShares (%) |
Value ($MM) |
Portfolio (%) |
ΔPortfolio (%) |
|
|---|---|---|---|---|---|---|---|---|---|
| KD / Kyndryl Holdings, Inc. | 0.67 | -16.52 | 23.27 | 25.69 | 1.7904 | 0.3761 | |||
| FLR / Fluor Corporation | 0.45 | 0.19 | 22.29 | 3.57 | 1.7147 | 0.0708 | |||
| MRCY / Mercury Systems, Inc. | 0.50 | 14.73 | 21.03 | 30.23 | 1.6182 | 0.3844 | |||
| ELF / e.l.f. Beauty, Inc. | 0.16 | 33.41 | 20.08 | 53.62 | 1.5446 | 0.5462 | |||
| PB / Prosperity Bancshares, Inc. | 0.26 | -0.24 | 19.66 | 4.30 | 1.5125 | 0.0726 | |||
| ALK / Alaska Air Group, Inc. | 0.30 | -14.01 | 19.65 | 23.16 | 1.5115 | 0.2929 | |||
| KMPR / Kemper Corporation | 0.30 | 0.21 | 19.60 | 8.70 | 1.5079 | 0.1305 | |||
| AR / Antero Resources Corporation | 0.55 | 2.84 | 19.43 | 25.81 | 1.4944 | 0.3150 | |||
| OLLI / Ollie's Bargain Outlet Holdings, Inc. | 0.18 | -13.80 | 19.42 | -2.68 | 1.4937 | -0.0304 | |||
| BXMT / Blackstone Mortgage Trust, Inc. | 1.10 | 25.61 | 19.08 | 15.03 | 1.4681 | 0.2009 | |||
| FRME / First Merchants Corporation | 0.48 | 70.83 | 19.03 | 83.19 | 1.4638 | 0.6703 | |||
| GMED / Globus Medical, Inc. | 0.22 | -0.34 | 18.55 | 15.23 | 1.4270 | 0.1972 | |||
| ICUI / ICU Medical, Inc. | 0.12 | -4.35 | 18.12 | -18.54 | 1.3939 | -0.3053 | |||
| HWC / Hancock Whitney Corporation | 0.32 | 8.19 | 17.63 | 15.70 | 1.3562 | 0.1923 | |||
| GTES / Gates Industrial Corporation plc | 0.85 | 13.21 | 17.54 | 32.70 | 1.3492 | 0.3396 | |||
| SIGI / Selective Insurance Group, Inc. | 0.18 | 0.20 | 17.27 | 0.43 | 1.3288 | 0.0151 | |||
| SFNC / Simmons First National Corporation | 0.77 | -16.79 | 17.18 | -14.32 | 1.3217 | -0.2100 | |||
| COLB / Columbia Banking System, Inc. | 0.63 | 0.10 | 17.00 | 3.55 | 1.3078 | 0.0537 | |||
| FHN / First Horizon Corporation | 0.83 | -15.33 | 16.81 | 9.80 | 1.2935 | 0.1238 | |||
| KTB / Kontoor Brands, Inc. | 0.19 | -17.89 | 16.60 | -14.24 | 1.2768 | -0.2015 | |||
| SAM / The Boston Beer Company, Inc. | 0.05 | 0.20 | 16.33 | 3.95 | 1.2563 | 0.0563 | |||
| FIBK / First Interstate BancSystem, Inc. | 0.50 | 13.63 | 16.13 | 20.26 | 1.2412 | 0.2164 | |||
| XHR / Xenia Hotels & Resorts, Inc. | 1.08 | 15.98 | 1.2295 | 1.2295 | |||||
| VBTX / Veritex Holdings, Inc. | 0.58 | -0.42 | 15.83 | 2.75 | 1.2176 | 0.0410 | |||
| ENOV / Enovis Corporation | 0.36 | 0.30 | 15.78 | 2.23 | 1.2141 | 0.0349 | |||
| RMBS / Rambus Inc. | 0.30 | -25.39 | 15.76 | -6.58 | 1.2125 | -0.0763 | |||
| UCBI / United Community Banks, Inc. | 0.49 | 15.73 | 1.2104 | 1.2104 | |||||
| FWRG / First Watch Restaurant Group, Inc. | 0.83 | 15.51 | 1.1928 | 1.1928 | |||||
| CPRX / Catalyst Pharmaceuticals, Inc. | 0.74 | -7.31 | 15.49 | -2.69 | 1.1918 | -0.0243 | |||
| ITT / ITT Inc. | 0.11 | 9.88 | 15.05 | 5.01 | 1.1581 | 0.0630 | |||
| RH / RH | 0.04 | -12.68 | 15.05 | 2.76 | 1.1575 | 0.0390 | |||
| NTST / NETSTREIT Corp. | 1.06 | 68.24 | 15.00 | 44.03 | 1.1536 | 0.3583 | |||
| SNV / Synovus Financial Corp. | 0.29 | 14.99 | 1.1532 | 1.1532 | |||||
| HLIO / Helios Technologies, Inc. | 0.33 | 24.98 | 14.85 | 16.96 | 1.1426 | 0.1726 | |||
| HL / Hecla Mining Company | 3.00 | 0.19 | 14.73 | -26.25 | 1.1332 | -0.3924 | |||
| TCBI / Texas Capital Bancshares, Inc. | 0.19 | -15.22 | 14.57 | -7.23 | 1.1210 | -0.0788 | |||
| HALO / Halozyme Therapeutics, Inc. | 0.30 | 37.65 | 14.45 | 14.97 | 1.1113 | 0.1515 | |||
| SGRY / Surgery Partners, Inc. | 0.68 | 12.94 | 14.34 | -25.84 | 1.1033 | -0.3740 | |||
| MWA / Mueller Water Products, Inc. | 0.63 | -21.50 | 14.28 | -18.60 | 1.0986 | -0.2416 | |||
| AXTA / Axalta Coating Systems Ltd. | 0.41 | 0.21 | 14.19 | -5.25 | 1.0915 | -0.0523 | |||
| WNS / WNS (Holdings) Limited | 0.30 | 14.18 | 1.0909 | 1.0909 | |||||
| KRG / Kite Realty Group Trust | 0.56 | 14.94 | 14.18 | 9.24 | 1.0909 | 0.0992 | |||
| AMPH / Amphastar Pharmaceuticals, Inc. | 0.38 | -8.11 | 14.12 | -29.69 | 1.0865 | -0.4480 | |||
| W / Wayfair Inc. | 0.31 | 20.33 | 13.94 | -5.07 | 1.0723 | -0.0494 | |||
| ALGT / Allegiant Travel Company | 0.15 | 13.83 | 1.0640 | 1.0640 | |||||
| MTDR / Matador Resources Company | 0.25 | 37.00 | 13.83 | 55.97 | 1.0636 | 0.3865 | |||
| PEGA / Pegasystems Inc. | 0.15 | 13.80 | 1.0617 | 1.0617 | |||||
| IRT / Independence Realty Trust, Inc. | 0.70 | -9.76 | 13.80 | -12.67 | 1.0613 | -0.1454 | |||
| SFM / Sprouts Farmers Market, Inc. | 0.11 | -21.96 | 13.78 | -10.19 | 1.0604 | -0.1120 | |||
| LNTH / Lantheus Holdings, Inc. | 0.15 | 24.01 | 13.76 | 1.08 | 1.0584 | 0.0187 | |||
| BFAM / Bright Horizons Family Solutions Inc. | 0.12 | 1.98 | 13.73 | -19.34 | 1.0565 | -0.2439 | |||
| ACVA / ACV Auctions Inc. | 0.63 | 13.55 | 1.0423 | 1.0423 | |||||
| HAYW / Hayward Holdings, Inc. | 0.88 | -0.79 | 13.45 | -1.12 | 1.0346 | -0.0043 | |||
| CALX / Calix, Inc. | 0.39 | 6.54 | 13.44 | -4.23 | 1.0336 | -0.0380 | |||
| ADMA / ADMA Biologics, Inc. | 0.78 | -21.90 | 13.42 | -33.00 | 1.0323 | -0.4976 | |||
| DX / Dynex Capital, Inc. | 1.06 | 29.12 | 13.41 | 28.01 | 1.0315 | 0.2314 | |||
| KFY / Korn Ferry | 0.20 | 8.99 | 13.38 | -2.30 | 1.0294 | -0.0168 | |||
| EPAC / Enerpac Tool Group Corp. | 0.32 | 3.72 | 13.31 | 1.73 | 1.0241 | 0.0246 | |||
| AHH / Armada Hoffler Properties, Inc. | 1.29 | 8.43 | 13.24 | 2.42 | 1.0188 | 0.0311 | |||
| BCO / The Brink's Company | 0.14 | -11.70 | 12.83 | -29.16 | 0.9868 | -0.3964 | |||
| FTI / TechnipFMC plc | 0.44 | -13.80 | 12.79 | -4.90 | 0.9840 | -0.0434 | |||
| OCFC / OceanFirst Financial Corp. | 0.70 | 34.44 | 12.63 | 30.90 | 0.9716 | 0.2346 | |||
| ATR / AptarGroup, Inc. | 0.08 | -8.46 | 12.59 | -10.22 | 0.9689 | -0.1027 | |||
| NWN / Northwest Natural Holding Company | 0.30 | -0.41 | 11.93 | -3.49 | 0.9175 | -0.0264 | |||
| TROX / Tronox Holdings plc | 1.18 | -4.68 | 11.87 | -34.39 | 0.9129 | -0.4687 | |||
| DAR / Darling Ingredients Inc. | 0.35 | 0.19 | 11.84 | -9.16 | 0.9112 | -0.0848 | |||
| AESI / Atlas Energy Solutions Inc. | 0.52 | 8.52 | 11.51 | 10.41 | 0.8853 | 0.0892 | |||
| STAG / STAG Industrial, Inc. | 0.33 | -18.41 | 11.27 | -29.41 | 0.8673 | -0.3526 | |||
| MMSI / Merit Medical Systems, Inc. | 0.11 | 0.61 | 10.97 | -1.53 | 0.8440 | -0.0071 | |||
| PIPR / Piper Sandler Companies | 0.04 | -7.40 | 10.91 | -2.14 | 0.8390 | -0.0123 | |||
| OI / O-I Glass, Inc. | 1.00 | 10.88 | 0.8374 | 0.8374 | |||||
| ALKS / Alkermes plc | 0.38 | 10.84 | 0.8338 | 0.8338 | |||||
| SSB / SouthState Corporation | 0.11 | -21.69 | 10.83 | -19.84 | 0.8331 | -0.1988 | |||
| PLYM / Plymouth Industrial REIT, Inc. | 0.59 | 10.43 | 0.8026 | 0.8026 | |||||
| MTH / Meritage Homes Corporation | 0.07 | 27.65 | 10.36 | -4.25 | 0.7970 | -0.0295 | |||
| LEVI / Levi Strauss & Co. | 0.60 | 10.30 | 0.7922 | 0.7922 | |||||
| NSA / National Storage Affiliates Trust | 0.27 | 17.96 | 10.19 | -7.23 | 0.7839 | -0.0551 | |||
| POR / Portland General Electric Company | 0.23 | -0.45 | 10.17 | -9.35 | 0.7825 | -0.0746 | |||
| EVH / Evolent Health, Inc. | 0.70 | 67.36 | 7.90 | -33.43 | 0.6075 | -0.2985 | |||
| PTEN / Patterson-UTI Energy, Inc. | 0.95 | 37.47 | 7.85 | 48.42 | 0.6037 | 0.1999 | |||
| IPAR / Interparfums, Inc. | 0.06 | -46.63 | 7.78 | -45.80 | 0.5986 | -0.4980 | |||
| ASPN / Aspen Aerogels, Inc. | 0.49 | 2.42 | 5.80 | -56.06 | 0.4465 | -0.5625 | |||
| EGP / EastGroup Properties, Inc. | 0.03 | 21.53 | 4.40 | 4.38 | 0.3389 | 0.0166 | |||
| CG / The Carlyle Group Inc. | 0.08 | -3.47 | 4.13 | 13.19 | 0.3176 | 0.0390 | |||
| CFG / Citizens Financial Group, Inc. | 0.09 | 55.93 | 3.94 | 66.16 | 0.3034 | 0.1221 | |||
| EQT / EQT Corporation | 0.09 | 2.41 | 3.92 | 28.89 | 0.3017 | 0.0693 | |||
| PR / Permian Resources Corporation | 0.27 | 44.01 | 3.85 | 52.15 | 0.2965 | 0.1030 | |||
| AAL / American Airlines Group Inc. | 0.22 | 3.84 | 0.2958 | 0.2958 | |||||
| SW / Smurfit Westrock Plc | 0.07 | 22.39 | 3.81 | 33.39 | 0.2932 | 0.0749 | |||
| UDR / UDR, Inc. | 0.09 | -10.68 | 3.72 | -14.49 | 0.2861 | -0.0461 | |||
| IP / International Paper Company | 0.07 | -10.20 | 3.65 | -1.08 | 0.2808 | -0.0010 | |||
| CUBE / CubeSmart | 0.08 | 20.90 | 3.45 | -3.77 | 0.2651 | -0.0084 | |||
| BRKR / Bruker Corporation | 0.06 | 41.03 | 3.44 | 19.70 | 0.2646 | 0.0451 | |||
| AVTR / Avantor, Inc. | 0.16 | 3.32 | 0.2558 | 0.2558 | |||||
| ENTG / Entegris, Inc. | 0.03 | 36.03 | 3.32 | 19.75 | 0.2552 | 0.0436 | |||
| CMS / CMS Energy Corporation | 0.05 | 2.38 | 3.25 | -3.39 | 0.2502 | -0.0069 | |||
| NI / NiSource Inc. | 0.08 | -28.34 | 3.11 | -23.98 | 0.2390 | -0.0732 | |||
| ALLY / Ally Financial Inc. | 0.08 | 3.05 | 0.2343 | 0.2343 | |||||
| PNR / Pentair plc | 0.03 | -27.71 | 3.01 | -25.62 | 0.2319 | -0.0776 | |||
| XPO / XPO, Inc. | 0.02 | -29.74 | 3.00 | -14.31 | 0.2308 | -0.0366 | |||
| DLTR / Dollar Tree, Inc. | 0.04 | 2.41 | 2.98 | 9.15 | 0.2293 | 0.0207 | |||
| CZR / Caesars Entertainment, Inc. | 0.09 | 20.89 | 2.97 | -3.20 | 0.2281 | -0.0059 | |||
| EG / Everest Group, Ltd. | 0.01 | 2.96 | 0.2281 | 0.2281 | |||||
| VTR / Ventas, Inc. | 0.05 | 11.70 | 2.96 | 2.57 | 0.2274 | 0.0073 | |||
| TOL / Toll Brothers, Inc. | 0.02 | 17.71 | 2.93 | -4.03 | 0.2251 | -0.0078 | |||
| JBL / Jabil Inc. | 0.02 | 2.93 | 0.2251 | 0.2251 | |||||
| RRX / Regal Rexnord Corporation | 0.02 | 2.37 | 2.92 | -4.27 | 0.2244 | -0.0083 | |||
| X / United States Steel Corporation | 0.08 | 22.58 | 2.89 | 17.93 | 0.2222 | 0.0351 | |||
| NCLH / Norwegian Cruise Line Holdings Ltd. | 0.11 | 2.87 | 0.2210 | 0.2210 | |||||
| CASY / Casey's General Stores, Inc. | 0.01 | 2.40 | 2.81 | 7.96 | 0.2159 | 0.0174 | |||
| CCJ / Cameco Corporation | 0.05 | 2.41 | 2.76 | 10.20 | 0.2120 | 0.0210 | |||
| IVV / iShares Trust - iShares Core S&P 500 ETF | 0.00 | 0.37 | 2.68 | 2.45 | 0.2061 | 0.0063 | |||
| CACI / CACI International Inc | 0.01 | -7.56 | 2.55 | -25.98 | 0.1964 | -0.0671 | |||
| MSA / MSA Safety Incorporated | 0.02 | 2.50 | 2.54 | -4.20 | 0.1951 | -0.0071 | |||
| NOG / Northern Oil and Gas, Inc. | 0.03 | 17.40 | 1.10 | 23.21 | 0.0849 | 0.0165 | |||
| NJR / New Jersey Resources Corporation | 0.02 | 0.00 | 1.08 | -1.19 | 0.0827 | -0.0004 | |||
| FOLD / Amicus Therapeutics, Inc. | 0.09 | 9.33 | 0.84 | -3.67 | 0.0648 | -0.0019 | |||
| WHD / Cactus, Inc. | 0.01 | 0.00 | 0.70 | -2.23 | 0.0539 | -0.0008 | |||
| TENB / Tenable Holdings, Inc. | 0.02 | 0.00 | 0.66 | -2.82 | 0.0504 | -0.0011 | |||
| AVNT / Avient Corporation | 0.02 | 0.65 | 0.0503 | 0.0503 | |||||
| XBI / SPDR Series Trust - SPDR S&P Biotech ETF | 0.01 | 0.00 | 0.49 | -8.72 | 0.0379 | -0.0034 | |||
| ITRI / Itron, Inc. | 0.00 | 47.75 | 0.49 | 50.15 | 0.0376 | 0.0127 | |||
| LITE / Lumentum Holdings Inc. | 0.00 | -27.53 | 0.38 | -4.05 | 0.0292 | -0.0010 | |||
| NCNO / nCino, Inc. | 0.01 | -15.86 | 0.38 | -10.40 | 0.0292 | -0.0032 | |||
| LANC / Lancaster Colony Corporation | 0.00 | 0.00 | 0.37 | -1.87 | 0.0283 | -0.0004 | |||
| CRL / Charles River Laboratories International, Inc. | 0.00 | -88.15 | 0.37 | -88.90 | 0.0282 | -0.2237 | |||
| NXST / Nexstar Media Group, Inc. | 0.00 | -97.14 | 0.36 | -97.27 | 0.0280 | -0.9904 | |||
| IWM / iShares Trust - iShares Russell 2000 ETF | 0.00 | 0.10 | 0.0075 | 0.0075 | |||||
| BMRN / BioMarin Pharmaceutical Inc. | 0.00 | 7.29 | 0.03 | 3.70 | 0.0022 | 0.0000 | |||
| SPXC / SPX Technologies, Inc. | 0.00 | -99.77 | 0.02 | -99.80 | 0.0017 | -0.8358 | |||
| DT / Dynatrace, Inc. | 0.00 | -99.23 | 0.01 | -99.27 | 0.0009 | -0.1137 | |||
| QTWO / Q2 Holdings, Inc. | 0.00 | -100.00 | 0.00 | 0.0000 | |||||
| AXS / AXIS Capital Holdings Limited | 0.00 | -100.00 | 0.00 | 0.0000 | |||||
| STNE / StoneCo Ltd. | 0.00 | -100.00 | 0.00 | -100.00 | -0.9333 | ||||
| LIVN / LivaNova PLC | 0.00 | -100.00 | 0.00 | 0.0000 | |||||
| CPA / Copa Holdings, S.A. | 0.00 | -100.00 | 0.00 | -100.00 | -0.9118 | ||||
| GNTX / Gentex Corporation | 0.00 | -100.00 | 0.00 | 0.0000 | |||||
| HHH / Howard Hughes Holdings Inc. | 0.00 | -100.00 | 0.00 | -100.00 | -1.0500 | ||||
| NGVT / Ingevity Corporation | 0.00 | -100.00 | 0.00 | 0.0000 | |||||
| VECO / Veeco Instruments Inc. | 0.00 | -100.00 | 0.00 | 0.0000 | |||||
| LAZ / Lazard, Inc. | 0.00 | -100.00 | 0.00 | 0.0000 | |||||
| ATI / ATI Inc. | 0.00 | -100.00 | 0.00 | 0.0000 | |||||
| LNT / Alliant Energy Corporation | 0.00 | -100.00 | 0.00 | 0.0000 | |||||
| JELD / JELD-WEN Holding, Inc. | 0.00 | -100.00 | 0.00 | -100.00 | -0.8190 | ||||
| SHO / Sunstone Hotel Investors, Inc. | 0.00 | -100.00 | 0.00 | 0.0000 |