Basic Stats
| Portfolio Value | $ 50,931,000 |
| Current Positions | 21 |
Latest Holdings, Performance, AUM (from 13F, 13D)
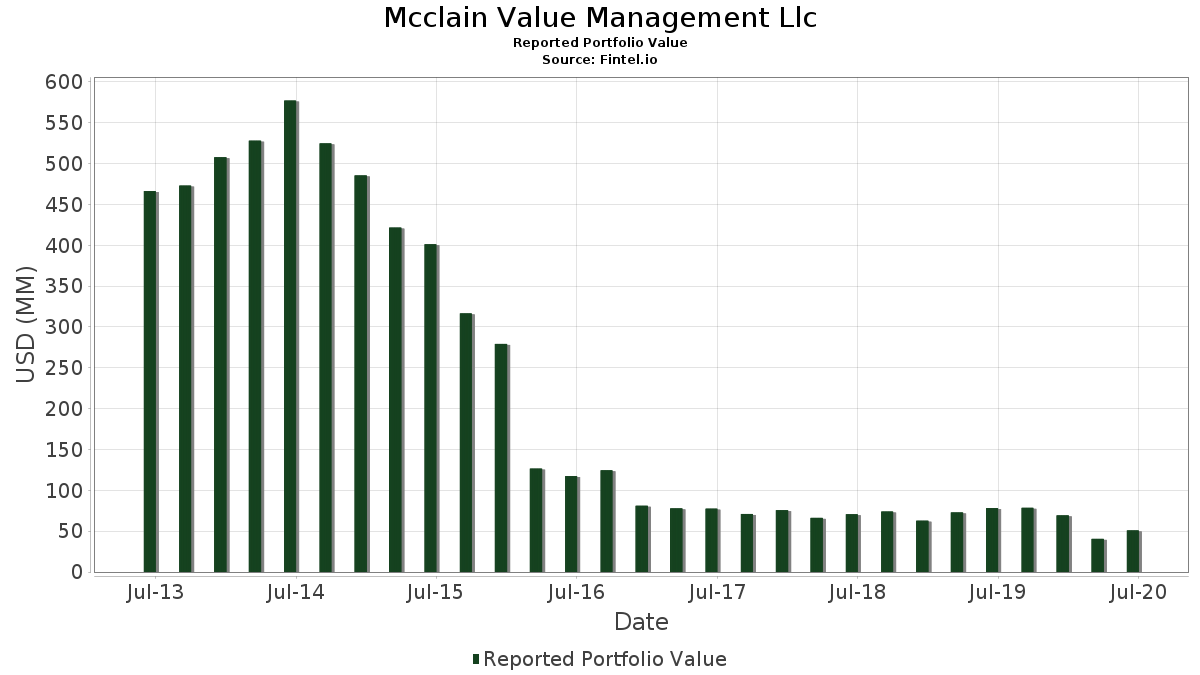
Mcclain Value Management Llc has disclosed 21 total holdings in their latest SEC filings. Most recent portfolio value is calculated to be $ 50,931,000 USD. Actual Assets Under Management (AUM) is this value plus cash (which is not disclosed). Mcclain Value Management Llc’s top holdings are Science Applications International Corporation (US:SAIC) , Perdoceo Education Corporation (US:PRDO) , Vistra Corp. (US:VST) , Barrick Mining Corporation (US:GOLD) , and Knowles Corporation (US:KN) . Mcclain Value Management Llc’s new positions include The AES Corporation (US:AES) , Parsley Energy, Inc. (US:US7018771029) , New Home Company Inc (The) (US:NWHM) , .
Top Increases This Quarter
We use the change in the portfolio allocation because this is the most meaningful metric. Changes can be due to trades or changes in share prices.
| Security | Shares (MM) |
Value (MM$) |
Portfolio % | ΔPortfolio % |
|---|---|---|---|---|
| 0.25 | 3.96 | 7.7674 | 7.7674 | |
| 0.23 | 3.36 | 6.5932 | 6.5932 | |
| 0.01 | 2.90 | 5.6999 | 1.7530 | |
| 0.38 | 3.17 | 6.2320 | 1.2867 | |
| 0.13 | 3.50 | 6.8740 | 0.7430 | |
| 0.02 | 0.22 | 0.4398 | 0.4398 | |
| 0.05 | 0.16 | 0.3102 | 0.3102 | |
| 0.02 | 0.15 | 0.3004 | 0.3004 | |
| 0.08 | 3.44 | 6.7621 | 0.2686 | |
| 0.23 | 3.47 | 6.8151 | 0.1343 |
Top Decreases This Quarter
We use the change in the portfolio allocation because this is the most meaningful metric. Changes can be due to trades or changes in share prices.
| Security | Shares (MM) |
Value (MM$) |
Portfolio % | ΔPortfolio % |
|---|---|---|---|---|
| 0.20 | 3.75 | 7.3727 | -5.5895 | |
| 0.02 | 1.14 | 2.2442 | -2.7109 | |
| 0.40 | 3.12 | 6.1220 | -2.6000 | |
| 0.16 | 2.62 | 5.1364 | -2.1805 | |
| 0.00 | 0.00 | -2.0264 | ||
| 0.90 | 1.24 | 2.4307 | -1.3509 | |
| 0.06 | 1.11 | 2.1873 | -1.2616 | |
| 0.00 | 0.00 | -0.7618 | ||
| 0.05 | 2.99 | 5.8668 | -0.4393 | |
| 0.14 | 0.95 | 1.8672 | -0.4131 |
13F and Fund Filings
This form was filed on 2020-08-04 for the reporting period 2020-06-30. Click the link icon to see the full transaction history.
Upgrade to unlock premium data and export to Excel ![]() .
.
| Security | Type | Avg Share Price | Shares (MM) |
ΔShares (%) |
ΔShares (%) |
Value ($MM) |
Portfolio (%) |
ΔPortfolio (%) |
|
|---|---|---|---|---|---|---|---|---|---|
| SAIC / Science Applications International Corporation | 0.06 | 18.85 | 4.29 | 23.69 | 8.4153 | -0.1268 | |||
| PRDO / Perdoceo Education Corporation | 0.25 | 3.96 | 7.7674 | 7.7674 | |||||
| VST / Vistra Corp. | 0.20 | -38.78 | 3.75 | -28.59 | 7.3727 | -5.5895 | |||
| GOLD / Barrick Mining Corporation | 0.13 | -4.29 | 3.50 | 40.77 | 6.8740 | 0.7430 | |||
| KN / Knowles Corporation | 0.23 | 12.29 | 3.47 | 28.08 | 6.8151 | 0.1343 | |||
| BG / Bunge Global SA | 0.08 | 30.48 | 3.44 | 30.75 | 6.7621 | 0.2686 | |||
| AES / The AES Corporation | 0.23 | 3.36 | 6.5932 | 6.5932 | |||||
| PDCO / Patterson Companies, Inc. | 0.15 | -11.84 | 3.21 | 26.85 | 6.3085 | 0.0641 | |||
| DFIN / Donnelley Financial Solutions, Inc. | 0.38 | -0.70 | 3.17 | 58.23 | 6.2320 | 1.2867 | |||
| BCOV / Brightcove Inc. | 0.40 | -22.05 | 3.12 | -11.87 | 6.1220 | -2.6000 | |||
| GIS / General Mills, Inc. | 0.05 | 0.00 | 2.99 | 16.81 | 5.8668 | -0.4393 | |||
| Y / Alleghany Corp. | 0.01 | 104.76 | 2.90 | 81.32 | 5.6999 | 1.7530 | |||
| UNM / Unum Group | 0.16 | -20.23 | 2.62 | -11.86 | 5.1364 | -2.1805 | |||
| ATI / ATI Inc. | 0.21 | 0.00 | 2.17 | 19.92 | 4.2548 | -0.1999 | |||
| AUD / Audacy Inc - Class A | 0.90 | 0.00 | 1.24 | -19.30 | 2.4307 | -1.3509 | |||
| ICFI / ICF International, Inc. | 0.02 | -39.71 | 1.14 | -43.13 | 2.2442 | -2.7109 | |||
| OXY / Occidental Petroleum Corporation | 0.06 | -49.65 | 1.11 | -20.37 | 2.1873 | -1.2616 | |||
| UTI / Universal Technical Institute, Inc. | 0.14 | -11.99 | 0.95 | 2.81 | 1.8672 | -0.4131 | |||
| US7018771029 / Parsley Energy, Inc. | 0.02 | 0.22 | 0.4398 | 0.4398 | |||||
| NWHM / New Home Company Inc (The) | 0.05 | 0.16 | 0.3102 | 0.3102 | |||||
| BZH / Beazer Homes USA, Inc. | 0.02 | 0.15 | 0.3004 | 0.3004 | |||||
| SAVE / Spirit Airlines, Inc. | 0.00 | -100.00 | 0.00 | -100.00 | -0.7618 | ||||
| AMRN / Amarin Corporation plc - Depositary Receipt (Common Stock) | 0.00 | -100.00 | 0.00 | -100.00 | -2.0264 |