Basic Stats
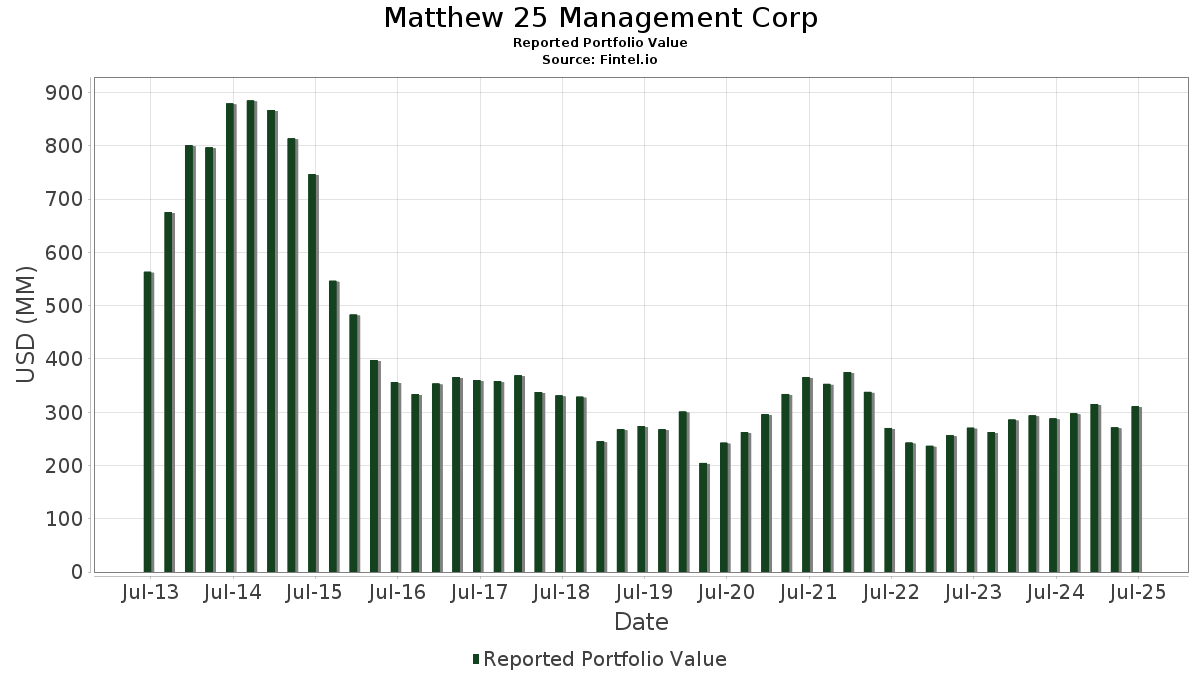
| Portfolio Value | $ 311,159,056 |
| Current Positions | 20 |
Latest Holdings, Performance, AUM (from 13F, 13D)
Matthew 25 Management Corp has disclosed 20 total holdings in their latest SEC filings. Most recent portfolio value is calculated to be $ 311,159,056 USD. Actual Assets Under Management (AUM) is this value plus cash (which is not disclosed). Matthew 25 Management Corp’s top holdings are NVIDIA Corporation (US:NVDA) , MercadoLibre, Inc. (US:MELI) , Amazon.com, Inc. (US:AMZN) , Flutter Entertainment plc (US:FLUT) , and The Goldman Sachs Group, Inc. (US:GS) . Matthew 25 Management Corp’s new positions include Eli Lilly and Company (US:LLY) , Huntington Ingalls Industries, Inc. (US:HII) , . Matthew 25 Management Corp’s top industries are "Oil And Gas Extraction" (sic 13) , "Non-depository Credit Institutions" (sic 61) , and "Miscellaneous Retail " (sic 59) .
Top Increases This Quarter
We use the change in the portfolio allocation because this is the most meaningful metric. Changes can be due to trades or changes in share prices.
| Security | Shares (MM) |
Value (MM$) |
Portfolio % | ΔPortfolio % |
|---|---|---|---|---|
| 0.45 | 71.49 | 22.9755 | 5.4605 | |
| 0.06 | 14.27 | 4.5857 | 3.3621 | |
| 0.01 | 5.65 | 1.8163 | 1.8163 | |
| 0.01 | 35.28 | 11.3395 | 1.2738 | |
| 0.01 | 1.21 | 0.3880 | 0.3880 | |
| 0.06 | 15.72 | 5.0511 | 0.2744 | |
| 0.02 | 15.57 | 5.0040 | 0.1720 | |
| 0.10 | 13.30 | 4.2753 | 0.0145 |
Top Decreases This Quarter
We use the change in the portfolio allocation because this is the most meaningful metric. Changes can be due to trades or changes in share prices.
| Security | Shares (MM) |
Value (MM$) |
Portfolio % | ΔPortfolio % |
|---|---|---|---|---|
| 0.10 | 1.04 | 0.3337 | -4.5175 | |
| 0.03 | 6.02 | 1.9356 | -1.8653 | |
| 0.42 | 8.90 | 2.8587 | -1.1994 | |
| 0.00 | 0.00 | -1.0621 | ||
| 0.00 | 12.39 | 3.9818 | -1.0207 | |
| 0.06 | 12.62 | 4.0551 | -0.9796 | |
| 0.04 | 10.23 | 3.2874 | -0.7556 | |
| 0.00 | 2.25 | 0.7224 | -0.3887 | |
| 0.09 | 12.79 | 4.1114 | -0.2840 | |
| 0.04 | 13.98 | 4.4919 | -0.2837 |
13D/G Filings
This is a list of 13D and 13G filings made in the last year (if any). Click the link icon to see the full transaction history. Green rows indicate new positions. Red rows indicate closed positions.
| File Date | Form | Security | Prev Shares |
Current Shares |
ΔShares % | % Ownership |
% ΔOwnership | |
|---|---|---|---|---|---|---|---|---|
| 2025-02-05 | AGMA / Federal Agricultural Mortgage Corp. - Class A | 71,500 | 79,484 | 11.17 | 7.70 | 10.95 |
13F and Fund Filings
This form was filed on 2025-08-06 for the reporting period 2025-06-30. Click the link icon to see the full transaction history.
Upgrade to unlock premium data and export to Excel ![]() .
.
| Security | Type | Avg Share Price | Shares (MM) |
ΔShares (%) |
ΔShares (%) |
Value ($MM) |
Portfolio (%) |
ΔPortfolio (%) |
|
|---|---|---|---|---|---|---|---|---|---|
| NVDA / NVIDIA Corporation | 0.45 | 3.19 | 71.49 | 50.43 | 22.9755 | 5.4605 | |||
| MELI / MercadoLibre, Inc. | 0.01 | -3.57 | 35.28 | 29.19 | 11.3395 | 1.2738 | |||
| AMZN / Amazon.com, Inc. | 0.14 | -1.72 | 31.26 | 13.33 | 10.0473 | -0.1200 | |||
| FLUT / Flutter Entertainment plc | 0.06 | -5.98 | 15.72 | 21.27 | 5.0511 | 0.2744 | |||
| GS / The Goldman Sachs Group, Inc. | 0.02 | -8.33 | 15.57 | 18.76 | 5.0040 | 0.1720 | |||
| JPM / JPMorgan Chase & Co. | 0.05 | -5.45 | 15.08 | 11.74 | 4.8449 | -0.1273 | |||
| TSM / Taiwan Semiconductor Manufacturing Company Limited - Depositary Receipt (Common Stock) | 0.06 | 215.00 | 14.27 | 329.76 | 4.5857 | 3.3621 | |||
| TSLA / Tesla, Inc. | 0.04 | -12.00 | 13.98 | 7.86 | 4.4919 | -0.2837 | |||
| KKR / KKR & Co. Inc. | 0.10 | 0.00 | 13.30 | 15.07 | 4.2753 | 0.0145 | |||
| AGMA / Federal Agricultural Mortgage Corp. - Class A | 0.09 | 7.64 | 12.79 | 7.26 | 4.1114 | -0.2840 | |||
| AAPL / Apple Inc. | 0.06 | 0.00 | 12.62 | -7.64 | 4.0551 | -0.9796 | |||
| BRK.A / Berkshire Hathaway Inc. | 0.00 | 0.00 | 12.39 | -8.72 | 3.9818 | -1.0207 | |||
| EWBC / East West Bancorp, Inc. | 0.12 | -2.04 | 12.12 | 10.20 | 3.8943 | -0.1580 | |||
| FDX / FedEx Corporation | 0.04 | 0.00 | 10.23 | -6.76 | 3.2874 | -0.7556 | |||
| TILE / Interface, Inc. | 0.42 | -23.42 | 8.90 | -19.22 | 2.8587 | -1.1994 | |||
| AGM / Federal Agricultural Mortgage Corporation | 0.03 | -43.64 | 6.02 | -41.61 | 1.9356 | -1.8653 | |||
| LLY / Eli Lilly and Company | 0.01 | 5.65 | 1.8163 | 1.8163 | |||||
| MA / Mastercard Incorporated | 0.00 | -27.27 | 2.25 | -25.45 | 0.7224 | -0.3887 | |||
| HII / Huntington Ingalls Industries, Inc. | 0.01 | 1.21 | 0.3880 | 0.3880 | |||||
| PK / Park Hotels & Resorts Inc. | 0.10 | -91.76 | 1.04 | -92.11 | 0.3337 | -4.5175 | |||
| NVO / Novo Nordisk A/S - Depositary Receipt (Common Stock) | 0.00 | -100.00 | 0.00 | -100.00 | -1.0621 |