Basic Stats
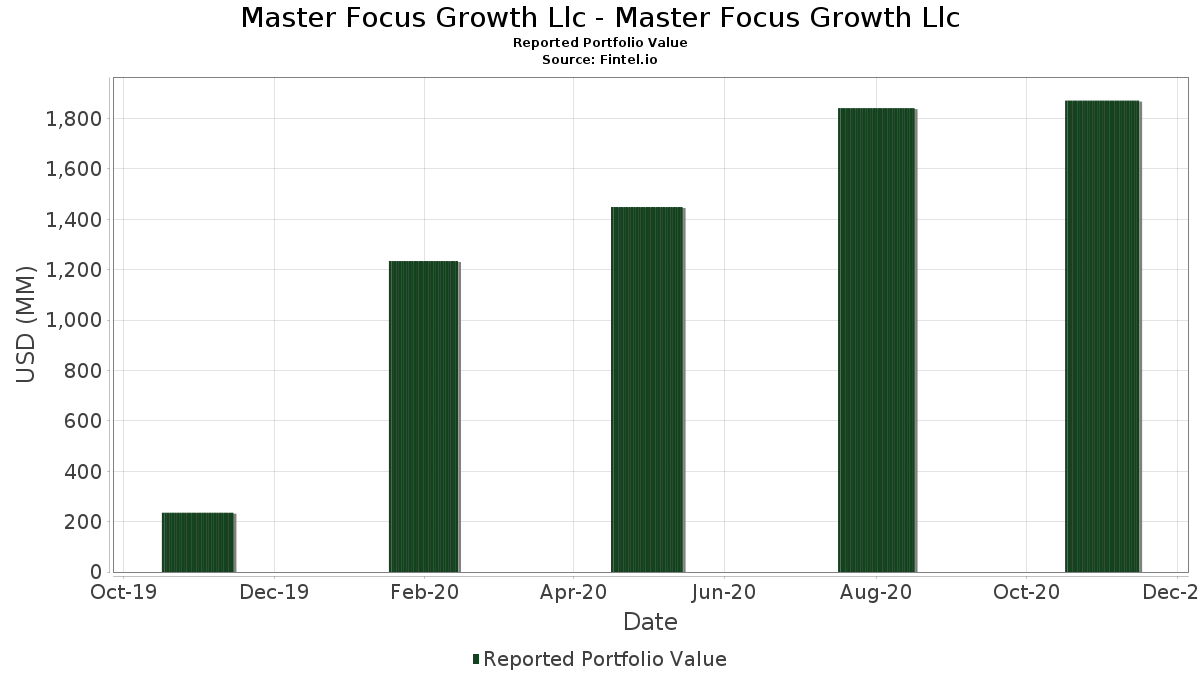
| Portfolio Value | $ 1,871,166,762 |
| Current Positions | 46 |
Latest Holdings, Performance, AUM (from 13F, 13D)
Master Focus Growth Llc - Master Focus Growth Llc has disclosed 46 total holdings in their latest SEC filings. Most recent portfolio value is calculated to be $ 1,871,166,762 USD. Actual Assets Under Management (AUM) is this value plus cash (which is not disclosed). Master Focus Growth Llc - Master Focus Growth Llc’s top holdings are Amazon.com, Inc. (US:AMZN) , Microsoft Corporation (US:MSFT) , Visa Inc. (US:V) , Mastercard Incorporated (US:MA) , and ServiceNow, Inc. (US:NOW) . Master Focus Growth Llc - Master Focus Growth Llc’s new positions include Wix.com Ltd. (US:WIX) , Marvell Technology, Inc. (US:MRVL) , Shopify Inc. (US:SHOP) , Roper Technologies, Inc. (US:ROP) , and .
Top Increases This Quarter
We use the change in the portfolio allocation because this is the most meaningful metric. Changes can be due to trades or changes in share prices.
| Security | Shares (MM) |
Value (MM$) |
Portfolio % | ΔPortfolio % |
|---|---|---|---|---|
| 0.10 | 25.49 | 1.3625 | 1.3625 | |
| 0.51 | 23.53 | 1.2578 | 1.2578 | |
| 24.57 | 24.57 | 1.3137 | 1.0230 | |
| 0.01 | 15.35 | 0.8208 | 0.8208 | |
| 1.09 | 48.37 | 2.5860 | 0.8125 | |
| 0.04 | 24.09 | 1.2880 | 0.7799 | |
| 0.74 | 13.58 | 0.7262 | 0.7262 | |
| 0.26 | 35.97 | 1.9227 | 0.6716 | |
| 0.20 | 28.26 | 1.5107 | 0.6180 | |
| 0.03 | 48.89 | 2.6135 | 0.5924 |
Top Decreases This Quarter
We use the change in the portfolio allocation because this is the most meaningful metric. Changes can be due to trades or changes in share prices.
| Security | Shares (MM) |
Value (MM$) |
Portfolio % | ΔPortfolio % |
|---|---|---|---|---|
| 0.06 | 205.64 | 10.9933 | -1.3376 | |
| 0.00 | 0.00 | -1.1871 | ||
| 0.07 | 17.70 | 0.9462 | -1.0784 | |
| 0.14 | 21.69 | 1.1597 | -0.7520 | |
| 0.14 | 37.15 | 1.9858 | -0.7078 | |
| 0.62 | 131.67 | 7.0388 | -0.6947 | |
| 0.02 | 15.39 | 0.8229 | -0.6430 | |
| 0.49 | 58.08 | 3.1046 | -0.6264 | |
| 0.21 | 70.75 | 3.7824 | -0.3708 | |
| 0.64 | 21.31 | 1.1393 | -0.3329 |
13F and Fund Filings
This form was filed on 2021-01-27 for the reporting period 2020-11-30. Click the link icon to see the full transaction history.
Upgrade to unlock premium data and export to Excel ![]() .
.
| Security | Type | Avg Share Price | Shares (MM) |
ΔShares (%) |
ΔShares (%) |
Value ($MM) |
Portfolio (%) |
ΔPortfolio (%) |
|
|---|---|---|---|---|---|---|---|---|---|
| AMZN / Amazon.com, Inc. | 0.06 | 1.41 | 205.64 | -6.90 | 10.9933 | -1.3376 | |||
| MSFT / Microsoft Corporation | 0.62 | 0.13 | 131.67 | -4.95 | 7.0388 | -0.6947 | |||
| V / Visa Inc. | 0.39 | 0.88 | 81.64 | 0.10 | 4.3643 | -0.1887 | |||
| MA / Mastercard Incorporated | 0.21 | 1.23 | 70.75 | -4.90 | 3.7824 | -0.3708 | |||
| NOW / ServiceNow, Inc. | 0.12 | 0.00 | 66.72 | 10.90 | 3.5667 | 0.2081 | |||
| GOOGL / Alphabet Inc. | 0.03 | 11.31 | 58.31 | 19.83 | 3.1172 | 0.4008 | |||
| AAPL / Apple Inc. | 0.49 | -5.81 | 58.08 | -13.11 | 3.1046 | -0.6264 | |||
| SPGI / S&P Global Inc. | 0.16 | 0.00 | 56.67 | -4.00 | 3.0297 | -0.2658 | |||
| META / Meta Platforms, Inc. | 0.20 | 28.57 | 56.60 | 21.45 | 3.0258 | 0.4241 | |||
| INTU / Intuit Inc. | 0.15 | 1.09 | 53.49 | 3.03 | 2.8595 | -0.0388 | |||
| MELI / MercadoLibre, Inc. | 0.03 | 1.59 | 48.89 | 35.04 | 2.6135 | 0.5924 | |||
| SNAP / Snap Inc. | 1.09 | -22.56 | 48.37 | 52.27 | 2.5860 | 0.8125 | |||
| NFLX / Netflix, Inc. | 0.10 | 0.00 | 48.36 | -7.34 | 2.5850 | -0.3282 | |||
| ASMLF / ASML Holding N.V. | 0.11 | 0.00 | 47.37 | 16.98 | 2.5322 | 0.2718 | |||
| CSGP / CoStar Group, Inc. | 0.05 | -3.76 | 47.35 | 3.27 | 2.5313 | -0.0283 | |||
| ADBE / Adobe Inc. | 0.10 | 1.11 | 46.35 | -5.77 | 2.4778 | -0.2681 | |||
| FICO / Fair Isaac Corporation | 0.10 | 5.69 | 46.26 | 18.75 | 2.4728 | 0.2983 | |||
| CPRT / Copart, Inc. | 0.39 | 0.00 | 44.60 | 11.74 | 2.3840 | 0.1560 | |||
| NKE / NIKE, Inc. | 0.31 | 0.00 | 41.58 | 20.38 | 2.2230 | 0.2947 | |||
| ADYEY / Adyen N.V. - Depositary Receipt (Common Stock) | 0.02 | -4.54 | 38.14 | 8.18 | 2.0388 | 0.0707 | |||
| BABA / Alibaba Group Holding Limited - Depositary Receipt (Common Stock) | 0.14 | -16.09 | 37.15 | -23.01 | 1.9858 | -0.7078 | |||
| ADI / Analog Devices, Inc. | 0.26 | 34.87 | 35.97 | 60.49 | 1.9227 | 0.6716 | |||
| LZAGY / Lonza Group AG - Depositary Receipt (Common Stock) | 0.06 | 0.00 | 34.94 | 1.25 | 1.8678 | -0.0586 | |||
| HUM / Humana Inc. | 0.08 | 5.57 | 33.16 | 1.85 | 1.7727 | -0.0449 | |||
| ADSK / Autodesk, Inc. | 0.11 | 7.12 | 31.89 | 22.17 | 1.7047 | 0.2476 | |||
| MTCH / Match Group, Inc. | 0.20 | 41.78 | 28.26 | 76.72 | 1.5107 | 0.6180 | |||
| SBAC / SBA Communications Corporation | 0.10 | 0.00 | 28.13 | -6.17 | 1.5039 | -0.1699 | |||
| ZTS / Zoetis Inc. | 0.16 | 0.00 | 26.02 | 0.18 | 1.3911 | -0.0591 | |||
| WIX / Wix.com Ltd. | 0.10 | 25.49 | 1.3625 | 1.3625 | |||||
| US09248U7182 / BlackRock Liquidity Funds: T-Fund, Institutional Shares | 24.57 | 371.87 | 24.57 | 371.92 | 1.3137 | 1.0230 | |||
| NVDA / NVIDIA Corporation | 0.04 | 164.17 | 24.09 | 164.72 | 1.2880 | 0.7799 | |||
| RNG / RingCentral, Inc. | 0.08 | 0.00 | 23.88 | 2.16 | 1.2766 | -0.0283 | |||
| MRVL / Marvell Technology, Inc. | 0.51 | 23.53 | 1.2578 | 1.2578 | |||||
| AZN / AstraZeneca PLC - Depositary Receipt (Common Stock) | 0.44 | 0.00 | 23.33 | -5.47 | 1.2473 | -0.1305 | |||
| LOW / Lowe's Companies, Inc. | 0.14 | -33.05 | 21.69 | -36.65 | 1.1597 | -0.7520 | |||
| SHW / The Sherwin-Williams Company | 0.03 | 0.00 | 21.52 | 11.41 | 1.1506 | 0.0721 | |||
| BSX / Boston Scientific Corporation | 0.64 | 0.00 | 21.31 | -19.19 | 1.1393 | -0.3329 | |||
| CRM / Salesforce, Inc. | 0.07 | -45.87 | 17.70 | -51.20 | 0.9462 | -1.0784 | |||
| ADPT / Adaptive Biotechnologies Corporation | 0.35 | 0.00 | 16.87 | 15.89 | 0.9019 | 0.0892 | |||
| ISRG / Intuitive Surgical, Inc. | 0.02 | -40.99 | 15.39 | -41.38 | 0.8229 | -0.6430 | |||
| SHOP / Shopify Inc. | 0.01 | 15.35 | 0.8208 | 0.8208 | |||||
| COUP / Coupa Software Inc | 0.04 | 9.75 | 14.64 | 10.14 | 0.7827 | 0.0406 | |||
| Postmates Inc, Series F / EC (000000000) | 0.74 | 13.58 | 0.7262 | 0.7262 | |||||
| ROP / Roper Technologies, Inc. | 0.02 | 7.35 | 0.3932 | 0.3932 | |||||
| C3 AI INC SERIES H / EC (000000000) | 1.19 | 6.45 | 0.3450 | 0.3450 | |||||
| Palantir Technologies, Inc. / EP (000000000) | 0.08 | 2.05 | 0.1094 | 0.1094 | |||||
| TJX / The TJX Companies, Inc. | 0.00 | -100.00 | 0.00 | -100.00 | -1.1871 |