Basic Stats
| Portfolio Value | $ 2,607,623,617 |
| Current Positions | 51 |
Latest Holdings, Performance, AUM (from 13F, 13D)
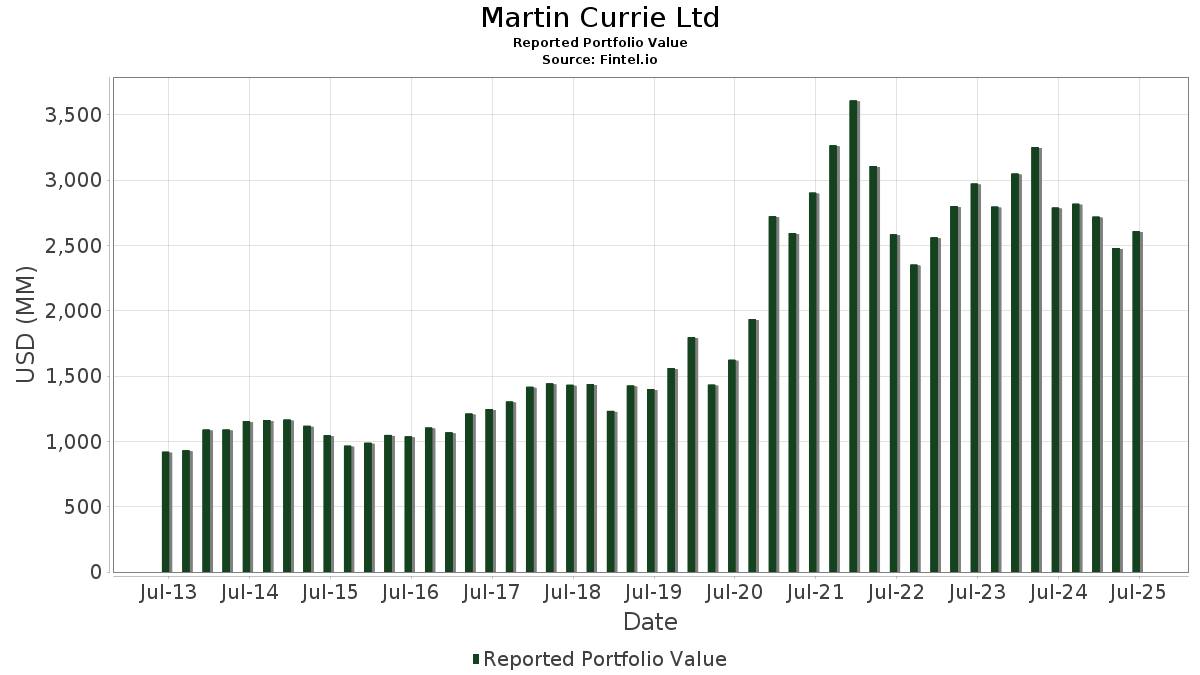
Martin Currie Ltd has disclosed 51 total holdings in their latest SEC filings. Most recent portfolio value is calculated to be $ 2,607,623,617 USD. Actual Assets Under Management (AUM) is this value plus cash (which is not disclosed). Martin Currie Ltd’s top holdings are Taiwan Semiconductor Manufacturing Company Limited - Depositary Receipt (Common Stock) (US:TSM) , HDFC Bank Limited - Depositary Receipt (Common Stock) (US:HDB) , Ferrari N.V. (US:RACE) , Microsoft Corporation (US:MSFT) , and NVIDIA Corporation (US:NVDA) . Martin Currie Ltd’s new positions include Inter & Co, Inc. (US:INTR) , UL Solutions Inc. (US:ULS) , .
Top Increases This Quarter
We use the change in the portfolio allocation because this is the most meaningful metric. Changes can be due to trades or changes in share prices.
| Security | Shares (MM) |
Value (MM$) |
Portfolio % | ΔPortfolio % |
|---|---|---|---|---|
| 3.77 | 28.04 | 1.0753 | 1.0753 | |
| 2.84 | 217.66 | 8.3471 | 0.6498 | |
| 0.33 | 165.56 | 4.5214 | 0.4365 | |
| 1.40 | 53.79 | 1.4690 | 0.1434 | |
| 0.00 | 0.25 | 0.0097 | 0.0097 | |
| 0.02 | 0.53 | 0.0144 | 0.0012 |
Top Decreases This Quarter
We use the change in the portfolio allocation because this is the most meaningful metric. Changes can be due to trades or changes in share prices.
| Security | Shares (MM) |
Value (MM$) |
Portfolio % | ΔPortfolio % |
|---|---|---|---|---|
| 1.31 | 149.13 | 4.0726 | -3.5323 | |
| 0.31 | 147.48 | 4.0276 | -2.0813 | |
| 1.10 | 248.99 | 6.7998 | -1.9219 | |
| 0.37 | 182.63 | 4.9874 | -1.7366 | |
| 0.56 | 32.58 | 0.8897 | -1.6398 | |
| 4.08 | 137.19 | 3.7465 | -1.5627 | |
| 1.12 | 36.53 | 0.9975 | -1.3605 | |
| 0.33 | 68.64 | 1.8745 | -1.1896 | |
| 0.16 | 88.44 | 2.4152 | -1.1519 | |
| 0.14 | 13.16 | 0.3594 | -1.0452 |
13F and Fund Filings
This form was filed on 2025-08-12 for the reporting period 2025-06-30. Click the link icon to see the full transaction history.
Upgrade to unlock premium data and export to Excel ![]() .
.
| Security | Type | Avg Share Price | Shares (MM) |
ΔShares (%) |
ΔShares (%) |
Value ($MM) |
Portfolio (%) |
ΔPortfolio (%) |
|
|---|---|---|---|---|---|---|---|---|---|
| TSM / Taiwan Semiconductor Manufacturing Company Limited - Depositary Receipt (Common Stock) | 1.10 | -15.61 | 248.99 | 15.14 | 6.7998 | -1.9219 | |||
| HDB / HDFC Bank Limited - Depositary Receipt (Common Stock) | 2.84 | -1.17 | 217.66 | 14.04 | 8.3471 | 0.6498 | |||
| RACE / Ferrari N.V. | 0.37 | -4.46 | 182.63 | 9.54 | 4.9874 | -1.7366 | |||
| MSFT / Microsoft Corporation | 0.33 | 23.36 | 165.56 | 63.46 | 4.5214 | 0.4365 | |||
| NVDA / NVIDIA Corporation | 0.96 | -9.22 | 152.42 | 32.33 | 4.1624 | -0.4827 | |||
| BABA / Alibaba Group Holding Limited - Depositary Receipt (Common Stock) | 1.31 | -7.79 | 149.13 | -20.92 | 4.0726 | -3.5323 | |||
| LIN / Linde plc | 0.31 | -3.37 | 147.48 | -2.64 | 4.0276 | -2.0813 | |||
| IBN / ICICI Bank Limited - Depositary Receipt (Common Stock) | 4.08 | -2.36 | 137.19 | 4.21 | 3.7465 | -1.5627 | |||
| MELI / MercadoLibre, Inc. | 0.04 | -2.56 | 95.18 | 30.54 | 2.5992 | -0.3413 | |||
| MA / Mastercard Incorporated | 0.16 | -2.47 | 88.44 | -0.01 | 2.4152 | -1.1519 | |||
| META / Meta Platforms, Inc. | 0.12 | -2.20 | 85.67 | 25.24 | 2.3395 | -0.4191 | |||
| VEEV / Veeva Systems Inc. | 0.24 | -3.43 | 68.99 | 20.06 | 1.8842 | -0.4334 | |||
| AAPL / Apple Inc. | 0.33 | -2.19 | 68.64 | -9.66 | 1.8745 | -1.1896 | |||
| MTD / Mettler-Toledo International Inc. | 0.05 | -5.86 | 64.13 | -6.36 | 1.7513 | -1.0106 | |||
| CDNS / Cadence Design Systems, Inc. | 0.20 | -7.23 | 62.54 | 12.40 | 1.7080 | -0.5360 | |||
| ADSK / Autodesk, Inc. | 0.18 | -22.72 | 56.54 | -8.62 | 1.5441 | -0.9513 | |||
| V / Visa Inc. | 0.15 | 12.73 | 54.47 | 14.21 | 1.4875 | -0.4359 | |||
| KSA / iShares Trust - iShares MSCI Saudi Arabia ETF | 1.40 | 75.67 | 53.79 | 63.66 | 1.4690 | 0.1434 | |||
| ZTS / Zoetis Inc. | 0.31 | 2.91 | 48.64 | -2.53 | 1.3282 | -0.6842 | |||
| IDXX / IDEXX Laboratories, Inc. | 0.08 | 3.84 | 44.12 | 32.62 | 1.2048 | -0.1368 | |||
| AMZN / Amazon.com, Inc. | 0.20 | -0.77 | 42.87 | 14.42 | 1.1708 | -0.3403 | |||
| JD / JD.com, Inc. - Depositary Receipt (Common Stock) | 1.12 | -21.30 | 36.53 | -37.53 | 0.9975 | -1.3605 | |||
| DECK / Deckers Outdoor Corporation | 0.35 | -2.34 | 35.85 | -9.98 | 0.9792 | -0.6271 | |||
| RMD / ResMed Inc. | 0.14 | -3.41 | 35.12 | 11.33 | 0.9592 | -0.3132 | |||
| MMYT / MakeMyTrip Limited | 0.34 | -3.14 | 33.18 | -3.11 | 0.9062 | -0.4750 | |||
| CMG / Chipotle Mexican Grill, Inc. | 0.59 | -2.35 | 32.87 | 9.20 | 0.8976 | -0.3163 | |||
| TCOM / Trip.com Group Limited - Depositary Receipt (Common Stock) | 0.56 | -43.68 | 32.58 | -48.06 | 0.8897 | -1.6398 | |||
| INTR / Inter & Co, Inc. | 3.77 | 28.04 | 1.0753 | 1.0753 | |||||
| LLY / Eli Lilly and Company | 0.03 | -0.86 | 26.93 | -6.42 | 0.7354 | -0.4252 | |||
| EPAM / EPAM Systems, Inc. | 0.12 | -2.52 | 21.97 | 2.09 | 0.6000 | -0.2679 | |||
| CRH / CRH plc | 0.18 | -20.48 | 16.85 | -16.21 | 0.4602 | -0.3509 | |||
| SNPS / Synopsys, Inc. | 0.03 | -1.00 | 14.25 | 18.36 | 0.3891 | -0.0964 | |||
| GLOB / Globant S.A. | 0.14 | -51.03 | 13.16 | -62.21 | 0.3594 | -1.0452 | |||
| ANSS / ANSYS, Inc. | 0.03 | -0.59 | 9.48 | 10.29 | 0.2588 | -0.0877 | |||
| AMAT / Applied Materials, Inc. | 0.05 | -0.57 | 8.55 | 25.44 | 0.2335 | -0.0414 | |||
| DXCM / DexCom, Inc. | 0.09 | -0.58 | 8.25 | 27.08 | 0.2253 | -0.0365 | |||
| CPRT / Copart, Inc. | 0.15 | -0.58 | 7.58 | -13.80 | 0.2070 | -0.1476 | |||
| INFY / Infosys Limited - Depositary Receipt (Common Stock) | 0.34 | -58.63 | 6.37 | -57.99 | 0.1740 | -0.4376 | |||
| EWY / iShares, Inc. - iShares MSCI South Korea ETF | 0.02 | -23.11 | 1.16 | 2.21 | 0.0316 | -0.0141 | |||
| FLSA / Franklin Templeton ETF Trust - Franklin FTSE Saudi Arabia ETF | 0.02 | 75.12 | 0.53 | 61.54 | 0.0144 | 0.0012 | |||
| ISRG / Intuitive Surgical, Inc. | 0.00 | -70.96 | 0.47 | -68.19 | 0.0129 | -0.0470 | |||
| IEMG / iShares, Inc. - iShares Core MSCI Emerging Markets ETF | 0.01 | -49.59 | 0.36 | -44.00 | 0.0100 | -0.0163 | |||
| VMI / Valmont Industries, Inc. | 0.00 | -70.87 | 0.34 | -66.70 | 0.0093 | -0.0319 | |||
| ECL / Ecolab Inc. | 0.00 | -75.02 | 0.32 | -73.47 | 0.0087 | -0.0395 | |||
| XYL / Xylem Inc. | 0.00 | -73.76 | 0.31 | -71.65 | 0.0085 | -0.0355 | |||
| RVTY / Revvity, Inc. | 0.00 | -71.57 | 0.29 | -74.05 | 0.0079 | -0.0369 | |||
| TYL / Tyler Technologies, Inc. | 0.00 | -72.52 | 0.27 | -72.06 | 0.0075 | -0.0319 | |||
| DE / Deere & Company | 0.00 | -71.31 | 0.26 | -69.00 | 0.0070 | -0.0264 | |||
| ULS / UL Solutions Inc. | 0.00 | 0.25 | 0.0097 | 0.0097 | |||||
| LRN / Stride, Inc. | 0.00 | -71.23 | 0.24 | -67.08 | 0.0065 | -0.0227 | |||
| VRRM / Verra Mobility Corporation | 0.01 | -70.83 | 0.20 | -67.21 | 0.0055 | -0.0191 | |||
| CSAN / Cosan S.A. - Depositary Receipt (Common Stock) | 0.00 | -100.00 | 0.00 | 0.0000 | |||||
| COUR / Coursera, Inc. | 0.00 | -100.00 | 0.00 | 0.0000 | |||||
| EXPO / Exponent, Inc. | 0.00 | -100.00 | 0.00 | 0.0000 | |||||
| ERII / Energy Recovery, Inc. | 0.00 | -100.00 | 0.00 | 0.0000 | |||||
| ILMN / Illumina, Inc. | 0.00 | -100.00 | 0.00 | 0.0000 | |||||
| PLNT / Planet Fitness, Inc. | 0.00 | -100.00 | 0.00 | 0.0000 | |||||
| LULU / lululemon athletica inc. | 0.00 | -100.00 | 0.00 | 0.0000 |