Basic Stats
| Portfolio Value | $ 3,063,000 |
| Current Positions | 16 |
Latest Holdings, Performance, AUM (from 13F, 13D)
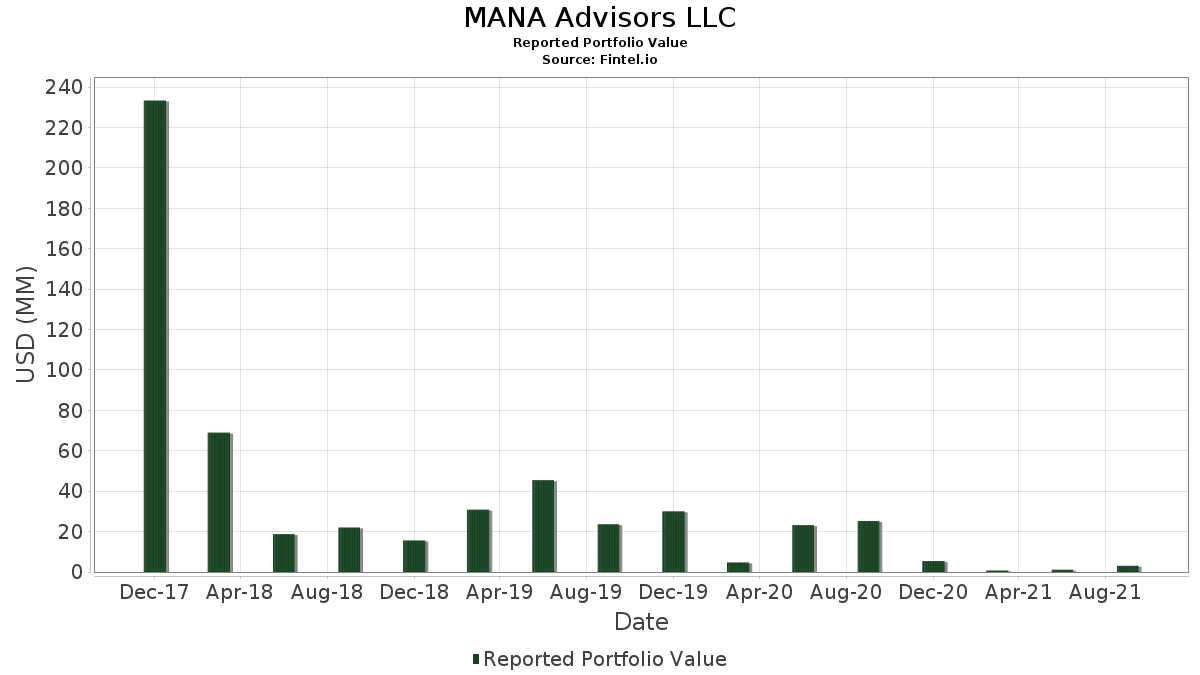
MANA Advisors LLC has disclosed 16 total holdings in their latest SEC filings. Most recent portfolio value is calculated to be $ 3,063,000 USD. Actual Assets Under Management (AUM) is this value plus cash (which is not disclosed). MANA Advisors LLC’s top holdings are Crown Castle Inc. (US:CCI) , Fidelity National Information Services, Inc. (US:FIS) , Microsoft Corporation (US:MSFT) , Owens Corning (US:OC) , and Alphabet Inc. (US:GOOGL) . MANA Advisors LLC’s new positions include Owens Corning (US:OC) , Humana Inc. (US:HUM) , Emeren Group Ltd - Depositary Receipt (Common Stock) (US:SOL) , Canoo Inc. (US:GOEV) , and .
Top Increases This Quarter
We use the change in the portfolio allocation because this is the most meaningful metric. Changes can be due to trades or changes in share prices.
| Security | Shares (MM) |
Value (MM$) |
Portfolio % | ΔPortfolio % |
|---|---|---|---|---|
| 0.00 | 0.28 | 9.2393 | 9.2393 | |
| 0.00 | 0.24 | 7.8681 | 7.8681 | |
| 0.00 | 0.23 | 7.3784 | 7.3784 | |
| 0.00 | 0.22 | 7.1825 | 7.1825 | |
| 0.00 | 0.22 | 7.1499 | 7.1499 | |
| 0.00 | 0.22 | 7.0519 | 7.0519 | |
| 0.00 | 0.21 | 6.9213 | 6.9213 | |
| 0.00 | 0.21 | 6.8234 | 6.8234 | |
| 0.01 | 0.21 | 6.7907 | 6.7907 | |
| 0.00 | 0.21 | 6.7581 | 6.7581 |
Top Decreases This Quarter
We use the change in the portfolio allocation because this is the most meaningful metric. Changes can be due to trades or changes in share prices.
| Security | Shares (MM) |
Value (MM$) |
Portfolio % | ΔPortfolio % |
|---|---|---|---|---|
| 0.00 | 0.00 | -24.5283 | ||
| 0.00 | 0.00 | -20.8446 | ||
| 0.00 | 0.00 | -20.5750 | ||
| 0.00 | 0.00 | -10.5121 | ||
| 0.00 | 0.00 | -7.0979 | ||
| 0.00 | 0.00 | -6.5588 | ||
| 0.00 | 0.00 | -5.8401 | ||
| 0.00 | 0.00 | -4.0431 |
13F and Fund Filings
This form was filed on 2021-11-12 for the reporting period 2021-09-30. Click the link icon to see the full transaction history.
Upgrade to unlock premium data and export to Excel ![]() .
.
| Security | Type | Avg Share Price | Shares (MM) |
ΔShares (%) |
ΔShares (%) |
Value ($MM) |
Portfolio (%) |
ΔPortfolio (%) |
|
|---|---|---|---|---|---|---|---|---|---|
| CCI / Crown Castle Inc. | 0.00 | 0.28 | 9.2393 | 9.2393 | |||||
| FIS / Fidelity National Information Services, Inc. | 0.00 | 0.24 | 7.8681 | 7.8681 | |||||
| MSFT / Microsoft Corporation | 0.00 | 0.23 | 7.3784 | 7.3784 | |||||
| OC / Owens Corning | 0.00 | 0.22 | 7.1825 | 7.1825 | |||||
| GOOGL / Alphabet Inc. | 0.00 | 0.22 | 7.1499 | 7.1499 | |||||
| HUM / Humana Inc. | 0.00 | 0.22 | 7.0519 | 7.0519 | |||||
| WMT / Walmart Inc. | 0.00 | 0.21 | 6.9213 | 6.9213 | |||||
| GOOGL / Alphabet Inc. | 0.00 | 0.21 | 6.8234 | 6.8234 | |||||
| TPR / Tapestry, Inc. | 0.01 | 0.21 | 6.7907 | 6.7907 | |||||
| HON / Honeywell International Inc. | 0.00 | 0.21 | 6.7581 | 6.7581 | |||||
| AAPL / Apple Inc. | 0.00 | 0.21 | 6.7254 | 6.7254 | |||||
| TLRY / Tilray Brands, Inc. | 0.01 | 0.16 | 5.1910 | 5.1910 | |||||
| SOL / Emeren Group Ltd - Depositary Receipt (Common Stock) | 0.02 | 0.14 | 4.4074 | 4.4074 | |||||
| NOV / NOV Inc. | 0.01 | 0.13 | 4.3095 | 4.3095 | |||||
| BB / BlackBerry Limited | 0.01 | 0.11 | 3.6565 | 3.6565 | |||||
| GOEV / Canoo Inc. | 0.01 | 0.08 | 2.5465 | 2.5465 | |||||
| CI / The Cigna Group | 0.00 | -100.00 | 0.00 | -100.00 | -20.8446 | ||||
| ACN / Accenture plc | 0.00 | -100.00 | 0.00 | -100.00 | -24.5283 | ||||
| GPN / Global Payments Inc. | 0.00 | -100.00 | 0.00 | -100.00 | -20.5750 | ||||
| RMED / Catheter Precision Inc. | 0.00 | -100.00 | 0.00 | -100.00 | -4.0431 | ||||
| KNDI / Kandi Technologies Group, Inc. | 0.00 | -100.00 | 0.00 | -100.00 | -6.5588 | ||||
| ALTO / Alto Ingredients, Inc. | 0.00 | -100.00 | 0.00 | -100.00 | -5.8401 | ||||
| GEO / The GEO Group, Inc. | 0.00 | -100.00 | 0.00 | -100.00 | -7.0979 | ||||
| MGI / Moneygram International Inc. | 0.00 | -100.00 | 0.00 | -100.00 | -10.5121 |