Basic Stats
| Manager | Hamish Douglass |
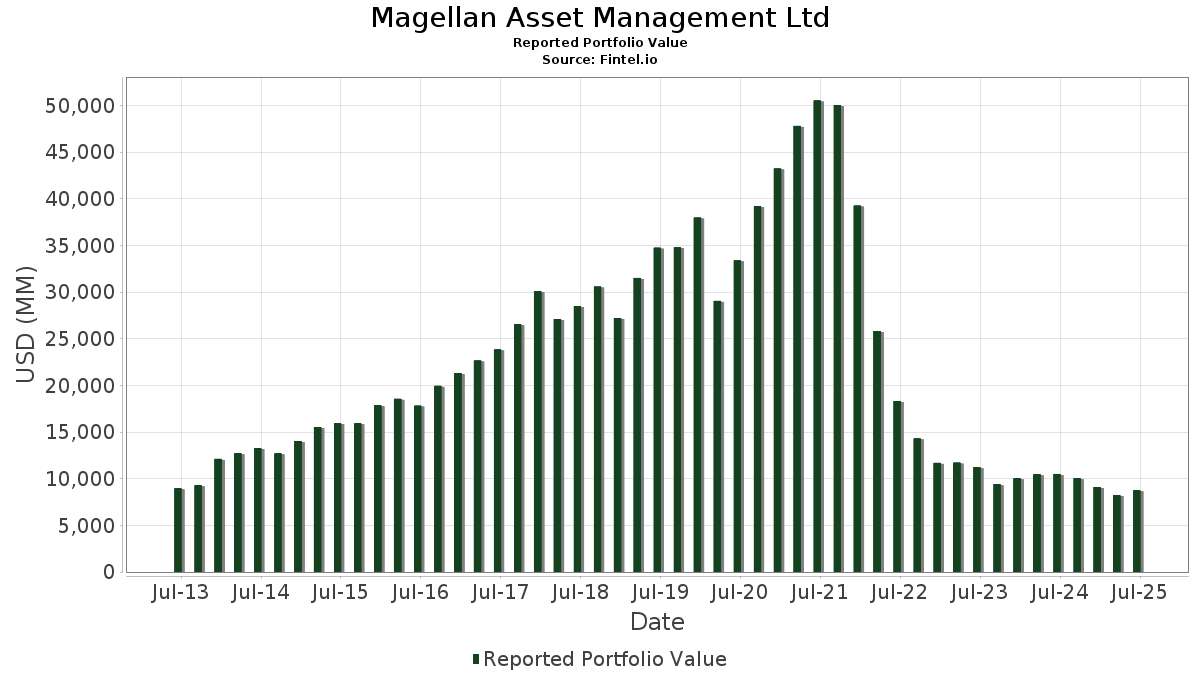
| Portfolio Value | $ 8,748,475,403 |
| Current Positions | 84 |
Latest Holdings, Performance, AUM (from 13F, 13D)
Magellan Asset Management Ltd has disclosed 84 total holdings in their latest SEC filings. Portfolio manager(s) are listed as Hamish Douglass. Most recent portfolio value is calculated to be $ 8,748,475,403 USD. Actual Assets Under Management (AUM) is this value plus cash (which is not disclosed). Magellan Asset Management Ltd’s top holdings are Microsoft Corporation (US:MSFT) , Amazon.com, Inc. (US:AMZN) , Meta Platforms, Inc. (US:META) , Eversource Energy (US:ES) , and Taiwan Semiconductor Manufacturing Company Limited - Depositary Receipt (Common Stock) (US:TSM) .
Top Increases This Quarter
We use the change in the portfolio allocation because this is the most meaningful metric. Changes can be due to trades or changes in share prices.
| Security | Shares (MM) |
Value (MM$) |
Portfolio % | ΔPortfolio % |
|---|---|---|---|---|
| 0.31 | 175.91 | 2.0108 | 2.0108 | |
| 2.36 | 162.98 | 1.8630 | 1.7325 | |
| 0.49 | 133.97 | 1.5314 | 1.5302 | |
| 1.93 | 436.15 | 4.9855 | 1.3478 | |
| 0.63 | 468.06 | 5.3502 | 1.2039 | |
| 3.15 | 691.93 | 7.9091 | 0.9033 | |
| 1.71 | 272.50 | 3.1148 | 0.7501 | |
| 1.94 | 137.52 | 1.5719 | 0.6866 | |
| 2.31 | 341.84 | 3.9074 | 0.6594 | |
| 0.96 | 43.27 | 0.4946 | 0.4828 |
Top Decreases This Quarter
We use the change in the portfolio allocation because this is the most meaningful metric. Changes can be due to trades or changes in share prices.
| Security | Shares (MM) |
Value (MM$) |
Portfolio % | ΔPortfolio % |
|---|---|---|---|---|
| 1.68 | 115.83 | 1.3240 | -0.8763 | |
| 0.82 | 256.71 | 2.9343 | -0.6183 | |
| 0.62 | 110.61 | 1.2643 | -0.5561 | |
| 1.12 | 196.94 | 2.2511 | -0.5122 | |
| 0.66 | 369.06 | 4.2186 | -0.4454 | |
| 0.41 | 155.39 | 1.7761 | -0.4036 | |
| 1.32 | 137.25 | 1.5688 | -0.3725 | |
| 1.33 | 136.76 | 1.5632 | -0.3396 | |
| 0.84 | 185.06 | 2.1153 | -0.2537 | |
| 2.26 | 171.09 | 1.9556 | -0.2527 |
13F and Fund Filings
This form was filed on 2025-08-07 for the reporting period 2025-06-30. Click the link icon to see the full transaction history.
Upgrade to unlock premium data and export to Excel ![]() .
.
| Security | Type | Avg Share Price | Shares (MM) |
ΔShares (%) |
ΔShares (%) |
Value ($MM) |
Portfolio (%) |
ΔPortfolio (%) |
|
|---|---|---|---|---|---|---|---|---|---|
| MSFT / Microsoft Corporation | 1.41 | -15.11 | 703.03 | 12.49 | 8.0360 | 0.4374 | |||
| AMZN / Amazon.com, Inc. | 3.15 | 4.14 | 691.93 | 20.08 | 7.9091 | 0.9033 | |||
| META / Meta Platforms, Inc. | 0.63 | 7.17 | 468.06 | 37.25 | 5.3502 | 1.2039 | |||
| ES / Eversource Energy | 6.95 | 1.10 | 442.29 | 3.56 | 5.0557 | -0.1369 | |||
| TSM / Taiwan Semiconductor Manufacturing Company Limited - Depositary Receipt (Common Stock) | 1.93 | 6.84 | 436.15 | 45.77 | 4.9855 | 1.3478 | |||
| MA / Mastercard Incorporated | 0.66 | -6.16 | 369.06 | -3.79 | 4.2186 | -0.4454 | |||
| YUM / Yum! Brands, Inc. | 2.31 | 35.89 | 341.84 | 27.96 | 3.9074 | 0.6594 | |||
| V / Visa Inc. | 0.88 | -1.80 | 311.26 | -0.51 | 3.5579 | -0.2459 | |||
| NFLX / Netflix, Inc. | 0.22 | -27.33 | 292.00 | 4.35 | 3.3378 | -0.0644 | |||
| CMG / Chipotle Mexican Grill, Inc. | 4.90 | 3.44 | 275.19 | 15.67 | 3.1455 | 0.2532 | |||
| PG / The Procter & Gamble Company | 1.71 | 49.86 | 272.50 | 40.10 | 3.1148 | 0.7501 | |||
| ICE / Intercontinental Exchange, Inc. | 1.45 | -3.64 | 266.49 | 2.49 | 3.0462 | -0.1151 | |||
| UNH / UnitedHealth Group Incorporated | 0.82 | 47.49 | 256.71 | -12.15 | 2.9343 | -0.6183 | |||
| SYK / Stryker Corporation | 0.53 | -1.06 | 209.98 | 5.16 | 2.4002 | -0.0276 | |||
| INTU / Intuit Inc. | 0.26 | -21.24 | 207.15 | 1.03 | 2.3678 | -0.1250 | |||
| D / Dominion Energy, Inc. | 3.64 | -0.86 | 205.56 | -0.06 | 2.3497 | -0.1510 | |||
| GOOGL / Alphabet Inc. | 1.12 | -23.97 | 196.94 | -13.35 | 2.2511 | -0.5122 | |||
| AMT / American Tower Corporation | 0.84 | -6.50 | 185.06 | -5.03 | 2.1153 | -0.2537 | |||
| MSCI / MSCI Inc. | 0.31 | 175.91 | 2.0108 | 2.0108 | |||||
| SRE / Sempra | 2.26 | -11.29 | 171.09 | -5.81 | 1.9556 | -0.2527 | |||
| EVRG / Evergy, Inc. | 2.36 | 1,418.68 | 162.98 | 1,418.25 | 1.8630 | 1.7325 | |||
| HCA / HCA Healthcare, Inc. | 0.41 | -21.83 | 155.39 | -13.33 | 1.7761 | -0.4036 | |||
| KO / The Coca-Cola Company | 1.94 | 91.18 | 137.52 | 88.86 | 1.5719 | 0.6866 | |||
| WEC / WEC Energy Group, Inc. | 1.32 | -10.10 | 137.25 | -14.05 | 1.5688 | -0.3725 | |||
| CCI / Crown Castle Inc. | 1.33 | -11.34 | 136.76 | -12.62 | 1.5632 | -0.3396 | |||
| XEL / Xcel Energy Inc. | 2.00 | -3.39 | 136.41 | -7.06 | 1.5592 | -0.2252 | |||
| CME / CME Group Inc. | 0.49 | 131,625.47 | 133.97 | 138,012.37 | 1.5314 | 1.5302 | |||
| NVO / Novo Nordisk A/S - Depositary Receipt (Common Stock) | 1.68 | -35.61 | 115.83 | -36.00 | 1.3240 | -0.8763 | |||
| GOOG / Alphabet Inc. | 0.62 | -34.94 | 110.61 | -26.13 | 1.2643 | -0.5561 | |||
| CSX / CSX Corporation | 3.18 | -8.96 | 103.69 | 0.94 | 1.1853 | -0.0636 | |||
| NSC / Norfolk Southern Corporation | 0.40 | -13.10 | 101.94 | -6.09 | 1.1653 | -0.1545 | |||
| BKNG / Booking Holdings Inc. | 0.01 | -29.06 | 49.19 | -10.85 | 0.5623 | -0.1086 | |||
| ZBH / Zimmer Biomet Holdings, Inc. | 0.51 | 16.76 | 46.14 | -5.91 | 0.5274 | -0.0688 | |||
| USB / U.S. Bancorp | 0.96 | 4,029.27 | 43.27 | 4,329.27 | 0.4946 | 0.4828 | |||
| DG / Dollar General Corporation | 0.37 | -37.33 | 42.16 | -18.48 | 0.4819 | -0.1469 | |||
| BRK.A / Berkshire Hathaway Inc. | 0.08 | 11.82 | 39.72 | 2.00 | 0.4541 | -0.0195 | |||
| AEP / American Electric Power Company, Inc. | 0.32 | 9.69 | 33.12 | 4.16 | 0.3786 | -0.0080 | |||
| EXC / Exelon Corporation | 0.76 | 4.39 | 32.96 | -1.63 | 0.3768 | -0.0306 | |||
| DUK / Duke Energy Corporation | 0.28 | 10.49 | 32.82 | 6.89 | 0.3751 | 0.0018 | |||
| SO / The Southern Company | 0.35 | 9.21 | 32.55 | 9.07 | 0.3720 | 0.0092 | |||
| NEE / NextEra Energy, Inc. | 0.47 | 17.67 | 32.40 | 15.23 | 0.3703 | 0.0285 | |||
| PEG / Public Service Enterprise Group Incorporated | 0.35 | 9.76 | 29.82 | 12.26 | 0.3408 | 0.0179 | |||
| ULTA / Ulta Beauty, Inc. | 0.06 | -19.56 | 29.80 | 2.67 | 0.3407 | -0.0123 | |||
| ED / Consolidated Edison, Inc. | 0.28 | 9.79 | 27.62 | -0.37 | 0.3157 | -0.0213 | |||
| MELI / MercadoLibre, Inc. | 0.01 | -11.07 | 25.52 | 19.14 | 0.2917 | 0.0313 | |||
| ETR / Entergy Corporation | 0.30 | 3.70 | 25.05 | 0.83 | 0.2863 | -0.0157 | |||
| MS / Morgan Stanley | 0.16 | 3.22 | 23.22 | 24.63 | 0.2655 | 0.0389 | |||
| CRM / Salesforce, Inc. | 0.08 | 9.23 | 21.46 | 10.99 | 0.2453 | 0.0102 | |||
| AWK / American Water Works Company, Inc. | 0.15 | -5.65 | 20.73 | -11.03 | 0.2370 | -0.0463 | |||
| AEE / Ameren Corporation | 0.21 | 8.58 | 20.16 | 3.86 | 0.2304 | -0.0055 | |||
| SBAC / SBA Communications Corporation | 0.08 | -0.52 | 19.12 | 6.19 | 0.2186 | -0.0004 | |||
| DTE / DTE Energy Company | 0.14 | 0.05 | 18.78 | -4.15 | 0.2147 | -0.0236 | |||
| YUMC / Yum China Holdings, Inc. | 0.41 | 18.48 | 0.2113 | 0.2113 | |||||
| ATO / Atmos Energy Corporation | 0.12 | -0.54 | 17.92 | -0.84 | 0.2048 | -0.0149 | |||
| FE / FirstEnergy Corp. | 0.41 | -1.03 | 16.66 | -1.42 | 0.1904 | -0.0150 | |||
| PPL / PPL Corporation | 0.48 | -0.69 | 16.21 | -6.79 | 0.1853 | -0.0262 | |||
| CNP / CenterPoint Energy, Inc. | 0.44 | -0.28 | 16.20 | 1.12 | 0.1852 | -0.0096 | |||
| CMS / CMS Energy Corporation | 0.20 | -0.42 | 13.89 | -8.15 | 0.1588 | -0.0251 | |||
| NI / NiSource Inc. | 0.34 | -0.94 | 13.85 | -0.32 | 0.1584 | -0.0106 | |||
| LNT / Alliant Energy Corporation | 0.17 | -0.75 | 10.41 | -6.73 | 0.1190 | -0.0167 | |||
| WTRG / Essential Utilities, Inc. | 0.20 | -0.53 | 7.40 | -6.54 | 0.0846 | -0.0117 | |||
| PNW / Pinnacle West Capital Corporation | 0.08 | -1.66 | 7.33 | -7.62 | 0.0837 | -0.0127 | |||
| OGE / OGE Energy Corp. | 0.13 | -1.48 | 5.90 | -4.87 | 0.0674 | -0.0080 | |||
| TMO / Thermo Fisher Scientific Inc. | 0.01 | 115.72 | 5.05 | 75.79 | 0.0577 | 0.0228 | |||
| IDA / IDACORP, Inc. | 0.04 | -3.47 | 4.06 | -4.11 | 0.0464 | -0.0051 | |||
| MDLZ / Mondelez International, Inc. | 0.06 | 1.10 | 3.86 | 0.47 | 0.0441 | -0.0026 | |||
| SPGI / S&P Global Inc. | 0.01 | 0.00 | 3.23 | 3.75 | 0.0370 | -0.0009 | |||
| TXNM / TXNM Energy, Inc. | 0.06 | -0.14 | 3.23 | 5.18 | 0.0369 | -0.0004 | |||
| POR / Portland General Electric Company | 0.07 | -0.97 | 3.01 | -9.77 | 0.0344 | -0.0062 | |||
| SR / Spire Inc. | 0.04 | -3.01 | 2.97 | -9.54 | 0.0339 | -0.0060 | |||
| OGS / ONE Gas, Inc. | 0.04 | -2.80 | 2.92 | -7.58 | 0.0333 | -0.0050 | |||
| ALE / ALLETE, Inc. | 0.04 | -2.48 | 2.66 | -4.91 | 0.0304 | -0.0036 | |||
| BKH / Black Hills Corporation | 0.05 | -0.53 | 2.56 | -7.96 | 0.0292 | -0.0046 | |||
| NWE / NorthWestern Energy Group, Inc. | 0.05 | -2.59 | 2.45 | -13.65 | 0.0281 | -0.0065 | |||
| AWR / American States Water Company | 0.03 | -2.09 | 2.04 | -4.63 | 0.0233 | -0.0027 | |||
| CWT / California Water Service Group | 0.04 | -4.51 | 1.98 | -10.37 | 0.0226 | -0.0042 | |||
| AVA / Avista Corporation | 0.05 | -3.54 | 1.92 | -12.55 | 0.0219 | -0.0047 | |||
| MGEE / MGE Energy, Inc. | 0.02 | -4.95 | 1.91 | -9.56 | 0.0218 | -0.0039 | |||
| CPK / Chesapeake Utilities Corporation | 0.01 | 1.44 | 1.44 | -5.07 | 0.0165 | -0.0020 | |||
| HTO / H2O America | 0.02 | -2.50 | 1.08 | -7.39 | 0.0123 | -0.0018 | |||
| NWN / Northwest Natural Holding Company | 0.02 | 3.47 | 0.86 | -3.80 | 0.0098 | -0.0010 | |||
| MSEX / Middlesex Water Company | 0.01 | -1.89 | 0.65 | -17.03 | 0.0075 | -0.0021 | |||
| PEP / PepsiCo, Inc. | 0.00 | 22.54 | 0.10 | 8.42 | 0.0012 | 0.0000 | |||
| BLK / BlackRock, Inc. | 0.00 | 14.29 | 0.08 | 27.12 | 0.0009 | 0.0001 | |||
| CL / Colgate-Palmolive Company | 0.00 | -100.00 | 0.00 | 0.0000 | |||||
| MCD / McDonald's Corporation | 0.00 | -100.00 | 0.00 | 0.0000 | |||||
| RSG / Republic Services, Inc. | 0.00 | -100.00 | 0.00 | 0.0000 | |||||
| AAPL / Apple Inc. | 0.00 | -100.00 | 0.00 | 0.0000 | |||||
| ADBE / Adobe Inc. | 0.00 | -100.00 | 0.00 | 0.0000 |