Basic Stats
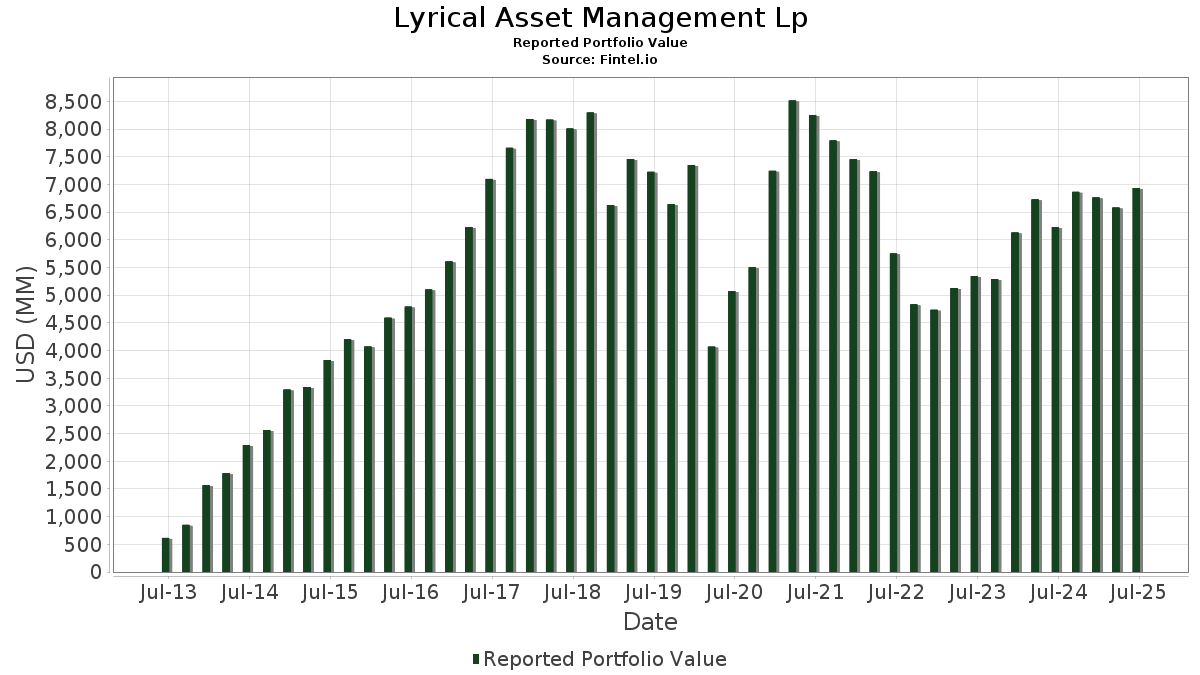
| Portfolio Value | $ 6,936,455,294 |
| Current Positions | 38 |
Latest Holdings, Performance, AUM (from 13F, 13D)
Lyrical Asset Management Lp has disclosed 38 total holdings in their latest SEC filings. Most recent portfolio value is calculated to be $ 6,936,455,294 USD. Actual Assets Under Management (AUM) is this value plus cash (which is not disclosed). Lyrical Asset Management Lp’s top holdings are NRG Energy, Inc. (US:NRG) , Flex Ltd. (US:FLEX) , United Rentals, Inc. (US:URI) , Ameriprise Financial, Inc. (US:AMP) , and Johnson Controls International plc (US:JCI) . Lyrical Asset Management Lp’s new positions include LKQ Corporation (US:LKQ) , .
Top Increases This Quarter
We use the change in the portfolio allocation because this is the most meaningful metric. Changes can be due to trades or changes in share prices.
| Security | Shares (MM) |
Value (MM$) |
Portfolio % | ΔPortfolio % |
|---|---|---|---|---|
| 3.15 | 505.04 | 7.2809 | 2.1062 | |
| 3.09 | 114.25 | 1.6471 | 1.6471 | |
| 11.72 | 107.70 | 1.5527 | 1.5322 | |
| 7.97 | 397.98 | 5.7375 | 1.4130 | |
| 3.46 | 365.56 | 5.2701 | 0.6874 | |
| 1.19 | 161.91 | 2.3342 | 0.3270 | |
| 2.71 | 252.58 | 3.6413 | 0.2684 | |
| 0.52 | 392.66 | 5.6608 | 0.2307 | |
| 1.33 | 169.89 | 2.4492 | 0.1892 | |
| 0.90 | 17.58 | 0.2535 | 0.0552 |
Top Decreases This Quarter
We use the change in the portfolio allocation because this is the most meaningful metric. Changes can be due to trades or changes in share prices.
| Security | Shares (MM) |
Value (MM$) |
Portfolio % | ΔPortfolio % |
|---|---|---|---|---|
| 4.63 | 236.22 | 3.4055 | -1.0069 | |
| 1.69 | 135.43 | 1.9524 | -0.7521 | |
| 0.64 | 213.62 | 3.0796 | -0.7512 | |
| 1.60 | 269.23 | 3.8813 | -0.5391 | |
| 2.01 | 109.20 | 1.5743 | -0.4883 | |
| 0.74 | 244.27 | 3.5216 | -0.4785 | |
| 0.64 | 125.99 | 1.8164 | -0.4633 | |
| 0.52 | 142.13 | 2.0490 | -0.4610 | |
| 0.77 | 113.42 | 1.6351 | -0.3358 | |
| 0.72 | 384.64 | 5.5452 | -0.2456 |
13F and Fund Filings
This form was filed on 2025-08-12 for the reporting period 2025-06-30. Click the link icon to see the full transaction history.
Upgrade to unlock premium data and export to Excel ![]() .
.
| Security | Type | Avg Share Price | Shares (MM) |
ΔShares (%) |
ΔShares (%) |
Value ($MM) |
Portfolio (%) |
ΔPortfolio (%) |
|
|---|---|---|---|---|---|---|---|---|---|
| NRG / NRG Energy, Inc. | 3.15 | -11.86 | 505.04 | 48.27 | 7.2809 | 2.1062 | |||
| FLEX / Flex Ltd. | 7.97 | -7.35 | 397.98 | 39.81 | 5.7375 | 1.4130 | |||
| URI / United Rentals, Inc. | 0.52 | -8.62 | 392.66 | 9.86 | 5.6608 | 0.2307 | |||
| AMP / Ameriprise Financial, Inc. | 0.72 | -8.47 | 384.64 | 0.91 | 5.5452 | -0.2456 | |||
| JCI / Johnson Controls International plc | 3.46 | -8.08 | 365.56 | 21.19 | 5.2701 | 0.6874 | |||
| AER / AerCap Holdings N.V. | 2.81 | -7.55 | 328.93 | 5.87 | 4.7421 | 0.0219 | |||
| FIS / Fidelity National Information Services, Inc. | 3.72 | -8.36 | 303.07 | -0.10 | 4.3692 | -0.2399 | |||
| FFIV / F5, Inc. | 0.99 | -7.28 | 290.92 | 2.48 | 4.1941 | -0.1185 | |||
| EBAY / eBay Inc. | 3.67 | -7.99 | 273.36 | 1.16 | 3.9409 | -0.1645 | |||
| HCA / HCA Healthcare, Inc. | 0.71 | -7.34 | 271.03 | 2.73 | 3.9073 | -0.1006 | |||
| EXPE / Expedia Group, Inc. | 1.60 | -7.79 | 269.23 | -7.47 | 3.8813 | -0.5391 | |||
| UBER / Uber Technologies, Inc. | 2.71 | -11.16 | 252.58 | 13.77 | 3.6413 | 0.2684 | |||
| CI / The Cigna Group | 0.74 | -7.67 | 244.27 | -7.23 | 3.5216 | -0.4785 | |||
| SU / Suncor Energy Inc. | 4.63 | -11.16 | 236.22 | -18.67 | 3.4055 | -1.0069 | |||
| GEN / Gen Digital Inc. | 7.93 | -7.13 | 233.12 | 2.88 | 3.3607 | -0.0818 | |||
| CPAY / Corpay, Inc. | 0.64 | -10.97 | 213.62 | -15.29 | 3.0796 | -0.7512 | |||
| ARW / Arrow Electronics, Inc. | 1.33 | -6.95 | 169.89 | 14.20 | 2.4492 | 0.1892 | |||
| SNX / TD SYNNEX Corporation | 1.19 | -6.12 | 161.91 | 22.55 | 2.3342 | 0.3270 | |||
| LAD / Lithia Motors, Inc. | 0.47 | -6.62 | 158.68 | 7.46 | 2.2876 | 0.0443 | |||
| PRI / Primerica, Inc. | 0.52 | -10.56 | 142.13 | -13.97 | 2.0490 | -0.4610 | |||
| GPN / Global Payments Inc. | 1.69 | -6.93 | 135.43 | -23.92 | 1.9524 | -0.7521 | |||
| AIZ / Assurant, Inc. | 0.64 | -10.82 | 125.99 | -16.04 | 1.8164 | -0.4633 | |||
| HSIC / Henry Schein, Inc. | 1.60 | -10.95 | 117.19 | -5.03 | 1.6895 | -0.1851 | |||
| WCC / WESCO International, Inc. | 0.62 | -10.55 | 114.57 | 6.67 | 1.6517 | 0.0200 | |||
| LKQ / LKQ Corporation | 3.09 | 114.25 | 1.6471 | 1.6471 | |||||
| WEX / WEX Inc. | 0.77 | -6.55 | 113.42 | -12.57 | 1.6351 | -0.3358 | |||
| CNC / Centene Corporation | 2.01 | -10.04 | 109.20 | -19.57 | 1.5743 | -0.4883 | |||
| AMCR / Amcor plc | 11.72 | 8,325.19 | 107.70 | 7,883.77 | 1.5527 | 1.5322 | |||
| AMG / Affiliated Managers Group, Inc. | 0.54 | -11.09 | 106.07 | 4.12 | 1.5291 | -0.0185 | |||
| AL / Air Lease Corporation | 1.71 | -10.98 | 100.20 | 7.78 | 1.4446 | 0.0321 | |||
| LEA / Lear Corporation | 1.00 | -5.84 | 94.82 | 1.37 | 1.3670 | -0.0540 | |||
| CNXC / Concentrix Corporation | 1.17 | -6.46 | 62.04 | -11.14 | 0.8943 | -0.1662 | |||
| ADNT / Adient plc | 0.90 | -10.99 | 17.58 | 34.69 | 0.2535 | 0.0552 | |||
| CCK / Crown Holdings, Inc. | 0.06 | 2.25 | 6.62 | 17.98 | 0.0955 | 0.0102 | |||
| NXPI / NXP Semiconductors N.V. | 0.03 | 1.66 | 5.85 | 16.87 | 0.0843 | 0.0083 | |||
| APTV / Aptiv PLC | 0.09 | 2.83 | 5.85 | 17.89 | 0.0843 | 0.0089 | |||
| NTDOY / Nintendo Co., Ltd. - Depositary Receipt (Common Stock) | 0.19 | -11.59 | 4.66 | 23.67 | 0.0672 | 0.0099 | |||
| IWD / iShares Trust - iShares Russell 1000 Value ETF | 0.00 | 0.21 | 0.0030 | 0.0030 | |||||
| BERY / Berry Global Group, Inc. | 0.00 | -100.00 | 0.00 | 0.0000 | |||||
| CNH / CNH Industrial N.V. | 0.00 | -100.00 | 0.00 | 0.0000 |