Basic Stats
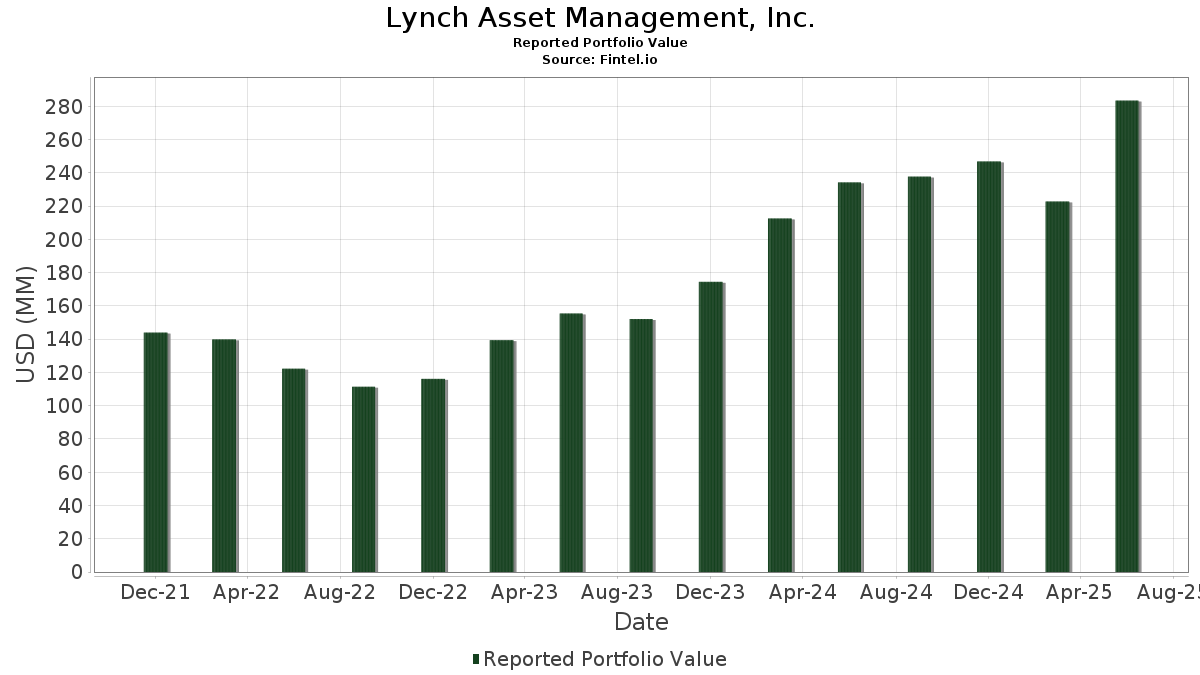
| Portfolio Value | $ 283,471,993 |
| Current Positions | 56 |
Latest Holdings, Performance, AUM (from 13F, 13D)
Lynch Asset Management, Inc. has disclosed 56 total holdings in their latest SEC filings. Most recent portfolio value is calculated to be $ 283,471,993 USD. Actual Assets Under Management (AUM) is this value plus cash (which is not disclosed). Lynch Asset Management, Inc.’s top holdings are NVIDIA Corporation (US:NVDA) , Meta Platforms, Inc. (US:META) , Alphabet Inc. (US:GOOGL) , Microsoft Corporation (US:MSFT) , and Amazon.com, Inc. (US:AMZN) . Lynch Asset Management, Inc.’s new positions include Broadcom Inc. (US:AVGO) , Eaton Corporation plc (US:ETN) , Vanguard Index Funds - Vanguard Growth ETF (US:VUG) , Vanguard Index Funds - Vanguard Value ETF (US:VTV) , and Walmart Inc. (US:WMT) .
Top Increases This Quarter
We use the change in the portfolio allocation because this is the most meaningful metric. Changes can be due to trades or changes in share prices.
| Security | Shares (MM) |
Value (MM$) |
Portfolio % | ΔPortfolio % |
|---|---|---|---|---|
| 0.54 | 84.86 | 29.9347 | 3.8431 | |
| 0.02 | 4.66 | 1.6434 | 1.6434 | |
| 0.01 | 3.93 | 1.3853 | 1.3853 | |
| 0.01 | 3.50 | 1.2344 | 1.0832 | |
| 0.01 | 3.65 | 1.2887 | 0.5326 | |
| 0.02 | 9.96 | 3.5138 | 0.4851 | |
| 0.02 | 8.07 | 2.8477 | 0.3987 | |
| 0.01 | 3.30 | 1.1641 | 0.3416 | |
| 0.04 | 5.17 | 1.8221 | 0.1758 | |
| 0.01 | 5.30 | 1.8684 | 0.1646 |
Top Decreases This Quarter
We use the change in the portfolio allocation because this is the most meaningful metric. Changes can be due to trades or changes in share prices.
| Security | Shares (MM) |
Value (MM$) |
Portfolio % | ΔPortfolio % |
|---|---|---|---|---|
| 0.05 | 8.51 | 3.0023 | -1.3096 | |
| 0.01 | 4.52 | 1.5958 | -1.0960 | |
| 0.04 | 8.03 | 2.8318 | -1.0292 | |
| 0.11 | 7.50 | 2.6466 | -0.7227 | |
| 0.03 | 3.88 | 1.3689 | -0.6660 | |
| 0.07 | 12.51 | 4.4140 | -0.5142 | |
| 0.02 | 4.01 | 1.4153 | -0.4941 | |
| 0.01 | 4.72 | 1.6658 | -0.4263 | |
| 0.02 | 6.04 | 2.1316 | -0.3657 | |
| 0.03 | 1.84 | 0.6478 | -0.3452 |
13F and Fund Filings
This form was filed on 2025-08-13 for the reporting period 2025-06-30. Click the link icon to see the full transaction history.
Upgrade to unlock premium data and export to Excel ![]() .
.
| Security | Type | Avg Share Price | Shares (MM) |
ΔShares (%) |
ΔShares (%) |
Value ($MM) |
Portfolio (%) |
ΔPortfolio (%) |
|
|---|---|---|---|---|---|---|---|---|---|
| NVDA / NVIDIA Corporation | 0.54 | 0.14 | 84.86 | 45.98 | 29.9347 | 3.8431 | |||
| META / Meta Platforms, Inc. | 0.02 | 0.00 | 13.05 | 28.06 | 4.6021 | 0.0296 | |||
| GOOGL / Alphabet Inc. | 0.07 | 0.00 | 12.51 | 13.96 | 4.4140 | -0.5142 | |||
| MSFT / Microsoft Corporation | 0.02 | 11.40 | 9.96 | 47.62 | 3.5138 | 0.4851 | |||
| AMZN / Amazon.com, Inc. | 0.04 | 0.00 | 9.25 | 15.31 | 3.2622 | -0.3374 | |||
| ABBV / AbbVie Inc. | 0.05 | 0.00 | 8.51 | -11.41 | 3.0023 | -1.3096 | |||
| NOW / ServiceNow, Inc. | 0.01 | 0.00 | 8.30 | 29.14 | 2.9286 | 0.0430 | |||
| CRWD / CrowdStrike Holdings, Inc. | 0.02 | 2.42 | 8.07 | 47.95 | 2.8477 | 0.3987 | |||
| AAPL / Apple Inc. | 0.04 | 1.03 | 8.03 | -6.67 | 2.8318 | -1.0292 | |||
| GS / The Goldman Sachs Group, Inc. | 0.01 | 0.00 | 7.82 | 29.56 | 2.7589 | 0.0494 | |||
| NVO / Novo Nordisk A/S - Depositary Receipt (Common Stock) | 0.11 | 0.56 | 7.50 | -0.05 | 2.6466 | -0.7227 | |||
| CMI / Cummins Inc. | 0.02 | 3.94 | 6.04 | 8.61 | 2.1316 | -0.3657 | |||
| MA / Mastercard Incorporated | 0.01 | 36.10 | 5.30 | 39.55 | 1.8684 | 0.1646 | |||
| DIS / The Walt Disney Company | 0.04 | 0.35 | 5.29 | 26.09 | 1.8669 | -0.0170 | |||
| AMD / Advanced Micro Devices, Inc. | 0.04 | 1.96 | 5.17 | 40.85 | 1.8221 | 0.1758 | |||
| PANW / Palo Alto Networks, Inc. | 0.02 | 3.88 | 4.93 | 24.58 | 1.7398 | -0.0371 | |||
| V / Visa Inc. | 0.01 | 0.00 | 4.72 | 1.31 | 1.6658 | -0.4263 | |||
| AVGO / Broadcom Inc. | 0.02 | 4.66 | 1.6434 | 1.6434 | |||||
| UNH / UnitedHealth Group Incorporated | 0.01 | 26.64 | 4.52 | -24.57 | 1.5958 | -1.0960 | |||
| VB / Vanguard Index Funds - Vanguard Small-Cap ETF | 0.02 | 4.39 | 4.23 | 11.56 | 1.4910 | -0.2095 | |||
| IBM / International Business Machines Corporation | 0.01 | 0.00 | 4.07 | 18.54 | 1.4350 | -0.1052 | |||
| FDX / FedEx Corporation | 0.02 | 1.15 | 4.01 | -5.67 | 1.4153 | -0.4941 | |||
| EMR / Emerson Electric Co. | 0.03 | 0.00 | 4.00 | 21.59 | 1.4110 | -0.0653 | |||
| ETN / Eaton Corporation plc | 0.01 | 3.93 | 1.3853 | 1.3853 | |||||
| CVX / Chevron Corporation | 0.03 | 0.00 | 3.88 | -14.41 | 1.3689 | -0.6660 | |||
| TSLA / Tesla, Inc. | 0.01 | 76.92 | 3.65 | 116.92 | 1.2887 | 0.5326 | |||
| TT / Trane Technologies plc | 0.01 | 700.00 | 3.50 | 941.37 | 1.2344 | 1.0832 | |||
| QCOM / QUALCOMM Incorporated | 0.02 | 0.00 | 3.33 | 3.68 | 1.1742 | -0.2668 | |||
| CI / The Cigna Group | 0.01 | 0.00 | 3.31 | 0.46 | 1.1662 | -0.3105 | |||
| HD / The Home Depot, Inc. | 0.01 | 80.00 | 3.30 | 80.08 | 1.1641 | 0.3416 | |||
| COST / Costco Wholesale Corporation | 0.00 | 37.50 | 3.27 | 43.94 | 1.1524 | 0.1336 | |||
| CMG / Chipotle Mexican Grill, Inc. | 0.05 | 0.00 | 2.81 | 11.83 | 0.9904 | -0.1364 | |||
| SPOT / Spotify Technology S.A. | 0.00 | 0.00 | 2.69 | 39.48 | 0.9474 | 0.0833 | |||
| ULTA / Ulta Beauty, Inc. | 0.01 | 0.00 | 2.55 | 27.64 | 0.8994 | 0.0028 | |||
| AVB / AvalonBay Communities, Inc. | 0.01 | 0.00 | 2.14 | -5.19 | 0.7538 | -0.2577 | |||
| NKE / NIKE, Inc. | 0.03 | -25.82 | 1.84 | -17.00 | 0.6478 | -0.3452 | |||
| VXUS / Vanguard STAR Funds - Vanguard Total International Stock ETF | 0.03 | -9.04 | 1.74 | 1.16 | 0.6130 | -0.1577 | |||
| SBUX / Starbucks Corporation | 0.02 | 0.00 | 1.73 | -6.55 | 0.6093 | -0.2206 | |||
| JNJ / Johnson & Johnson | 0.01 | 0.90 | 1.70 | -7.04 | 0.6008 | -0.2217 | |||
| PFE / Pfizer Inc. | 0.05 | 0.00 | 1.13 | -4.31 | 0.3993 | -0.1318 | |||
| MRK / Merck & Co., Inc. | 0.01 | 2.27 | 0.71 | -9.76 | 0.2513 | -0.1032 | |||
| C / Citigroup Inc. | 0.01 | 0.00 | 0.43 | 20.06 | 0.1501 | -0.0092 | |||
| VUG / Vanguard Index Funds - Vanguard Growth ETF | 0.00 | 0.19 | 0.0685 | 0.0685 | |||||
| GEHC / GE HealthCare Technologies Inc. | 0.00 | 0.00 | 0.19 | -7.96 | 0.0653 | -0.0252 | |||
| JAKK / JAKKS Pacific, Inc. | 0.01 | 0.16 | 0.0557 | 0.0557 | |||||
| VTV / Vanguard Index Funds - Vanguard Value ETF | 0.00 | 0.14 | 0.0510 | 0.0510 | |||||
| WMT / Walmart Inc. | 0.00 | 0.08 | 0.0276 | 0.0276 | |||||
| VOO / Vanguard Index Funds - Vanguard S&P 500 ETF | 0.00 | 0.06 | 0.0194 | 0.0194 | |||||
| SCHF / Schwab Strategic Trust - Schwab International Equity ETF | 0.00 | 0.04 | 0.0156 | 0.0156 | |||||
| PSX / Phillips 66 | 0.00 | 0.04 | 0.0147 | 0.0147 | |||||
| XOM / Exxon Mobil Corporation | 0.00 | 0.04 | 0.0133 | 0.0133 | |||||
| OGE / OGE Energy Corp. | 0.00 | 0.04 | 0.0125 | 0.0125 | |||||
| DKNG / DraftKings Inc. | 0.00 | 0.03 | 0.0121 | 0.0121 | |||||
| DUK / Duke Energy Corporation | 0.00 | 0.03 | 0.0104 | 0.0104 | |||||
| PK / Park Hotels & Resorts Inc. | 0.00 | 0.01 | 0.0043 | 0.0043 | |||||
| SPYD / SPDR Series Trust - SPDR Portfolio S&P 500 High Dividend ETF | 0.00 | 0.01 | 0.0037 | 0.0037 | |||||
| CMCSA / Comcast Corporation | 0.00 | -100.00 | 0.00 | 0.0000 | |||||
| PYPL / PayPal Holdings, Inc. | 0.00 | -100.00 | 0.00 | 0.0000 | |||||
| BPRN / Princeton Bancorp, Inc. | 0.00 | -100.00 | 0.00 | 0.0000 |