Basic Stats
| Insider Profile | Litespeed Management, L.L.C. |
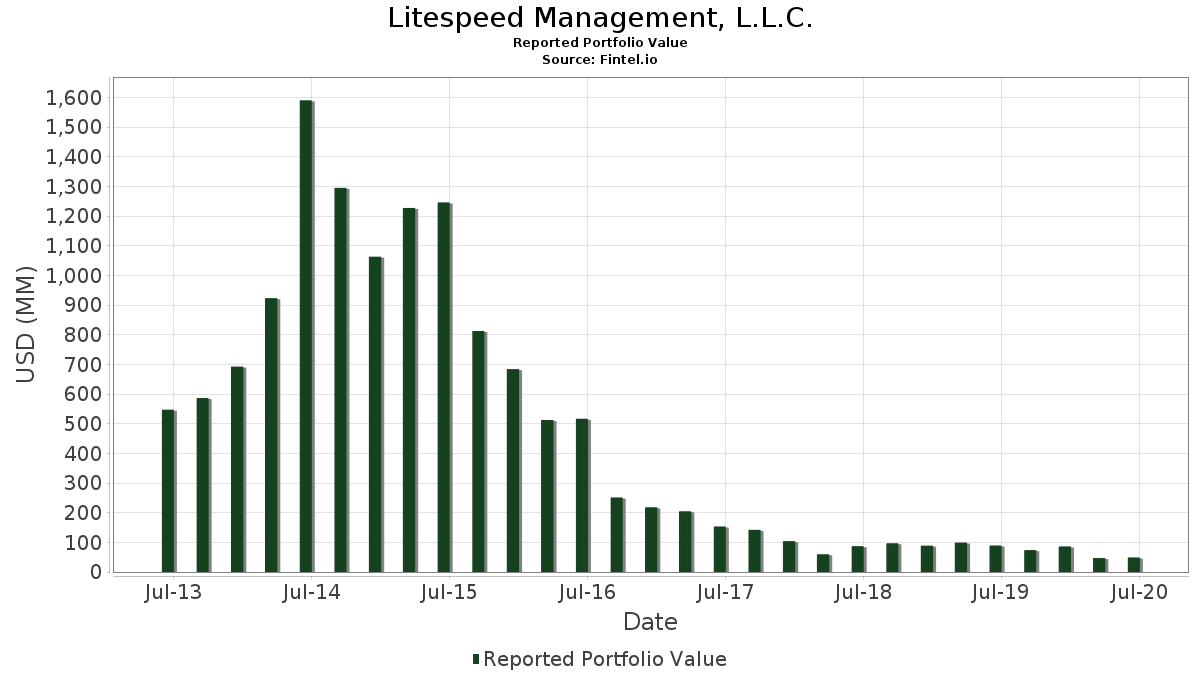
| Portfolio Value | $ 48,209,000 |
| Current Positions | 14 |
Latest Holdings, Performance, AUM (from 13F, 13D)
Litespeed Management, L.L.C. has disclosed 14 total holdings in their latest SEC filings. Most recent portfolio value is calculated to be $ 48,209,000 USD. Actual Assets Under Management (AUM) is this value plus cash (which is not disclosed). Litespeed Management, L.L.C.’s top holdings are R1 RCM Inc. (US:RCM) , Macquarie Infrastructure Holdings LLC - Units (US:MIC) , Genworth Financial, Inc. (US:GNW) , The E.W. Scripps Company (US:SSP) , and Taubman Centers, Inc. (US:US8766641034) . Litespeed Management, L.L.C.’s new positions include The Manitowoc Company, Inc. (US:MTW) , Pitney Bowes Inc. (US:PBI) , .
Top Increases This Quarter
We use the change in the portfolio allocation because this is the most meaningful metric. Changes can be due to trades or changes in share prices.
| Security | Shares (MM) |
Value (MM$) |
Portfolio % | ΔPortfolio % |
|---|---|---|---|---|
| 0.11 | 4.11 | 8.5212 | 8.5212 | |
| 0.43 | 2.78 | 5.7624 | 5.7624 | |
| 0.20 | 1.77 | 3.6798 | 3.6798 | |
| 0.98 | 10.88 | 22.5746 | 3.4740 | |
| 0.27 | 8.51 | 17.6585 | 2.8525 | |
| 0.03 | 2.22 | 4.6029 | 1.3330 | |
| 0.03 | 0.47 | 0.9749 | 0.9749 | |
| 0.48 | 4.23 | 8.7660 | 0.9260 | |
| 0.04 | 0.42 | 0.8816 | 0.8816 | |
| 0.13 | 0.34 | 0.6970 | 0.6970 |
Top Decreases This Quarter
We use the change in the portfolio allocation because this is the most meaningful metric. Changes can be due to trades or changes in share prices.
| Security | Shares (MM) |
Value (MM$) |
Portfolio % | ΔPortfolio % |
|---|---|---|---|---|
| 2.95 | 6.82 | 14.1364 | -6.9469 | |
| 0.00 | 0.00 | -5.7584 | ||
| 0.00 | 0.00 | -1.6016 | ||
| 0.25 | 2.83 | 5.8703 | -0.0689 | |
| 0.00 | 0.04 | 0.0788 | -0.0030 |
13F and Fund Filings
This form was filed on 2020-08-14 for the reporting period 2020-06-30. Click the link icon to see the full transaction history.
Upgrade to unlock premium data and export to Excel ![]() .
.
| Security | Type | Avg Share Price | Shares (MM) |
ΔShares (%) |
ΔShares (%) |
Value ($MM) |
Portfolio (%) |
ΔPortfolio (%) |
|
|---|---|---|---|---|---|---|---|---|---|
| RCM / R1 RCM Inc. | 0.98 | 0.00 | 10.88 | 22.65 | 22.5746 | 3.4740 | |||
| MIC / Macquarie Infrastructure Holdings LLC - Units | 0.27 | 0.00 | 8.51 | 23.77 | 17.6585 | 2.8525 | |||
| GNW / Genworth Financial, Inc. | 2.95 | 0.00 | 6.82 | -30.42 | 14.1364 | -6.9469 | |||
| SSP / The E.W. Scripps Company | 0.48 | 0.00 | 4.23 | 16.04 | 8.7660 | 0.9260 | |||
| US8766641034 / Taubman Centers, Inc. | 0.11 | 90.88 | 4.11 | 72.10 | 8.5212 | 8.5212 | |||
| TGNA / TEGNA Inc. | 0.25 | 0.00 | 2.83 | 2.57 | 5.8703 | -0.0689 | |||
| 98235T107 / Wright Medical Group N.V. | 0.09 | 8.05 | 2.79 | 12.12 | 5.7956 | 0.4312 | |||
| US33812L1026 / Fitbit Inc. | 0.43 | 0.00 | 2.78 | -3.00 | 5.7624 | 5.7624 | |||
| EXPE / Expedia Group, Inc. | 0.03 | 0.00 | 2.22 | 46.08 | 4.6029 | 1.3330 | |||
| PCG / PG&E Corporation | 0.20 | 1.77 | 3.6798 | 3.6798 | |||||
| US2241221017 / Craft Brew Alliance, Inc. | 0.03 | -55.10 | 0.47 | -53.65 | 0.9749 | 0.9749 | |||
| MTW / The Manitowoc Company, Inc. | 0.04 | 0.42 | 0.8816 | 0.8816 | |||||
| PBI / Pitney Bowes Inc. | 0.13 | 0.34 | 0.6970 | 0.6970 | |||||
| LYB / LyondellBasell Industries N.V. | 0.00 | 0.00 | 0.04 | 0.00 | 0.0788 | -0.0030 | |||
| CZR / Caesars Entertainment, Inc. | 0.00 | -100.00 | 0.00 | -100.00 | -1.6016 | ||||
| NPTN / NeoPhotonics Corporation | 0.00 | -100.00 | 0.00 | -100.00 | -5.7584 | ||||
| US63934E1082 / Navistar International Corp | 0.00 | -100.00 | 0.00 | 0.0000 |