Basic Stats
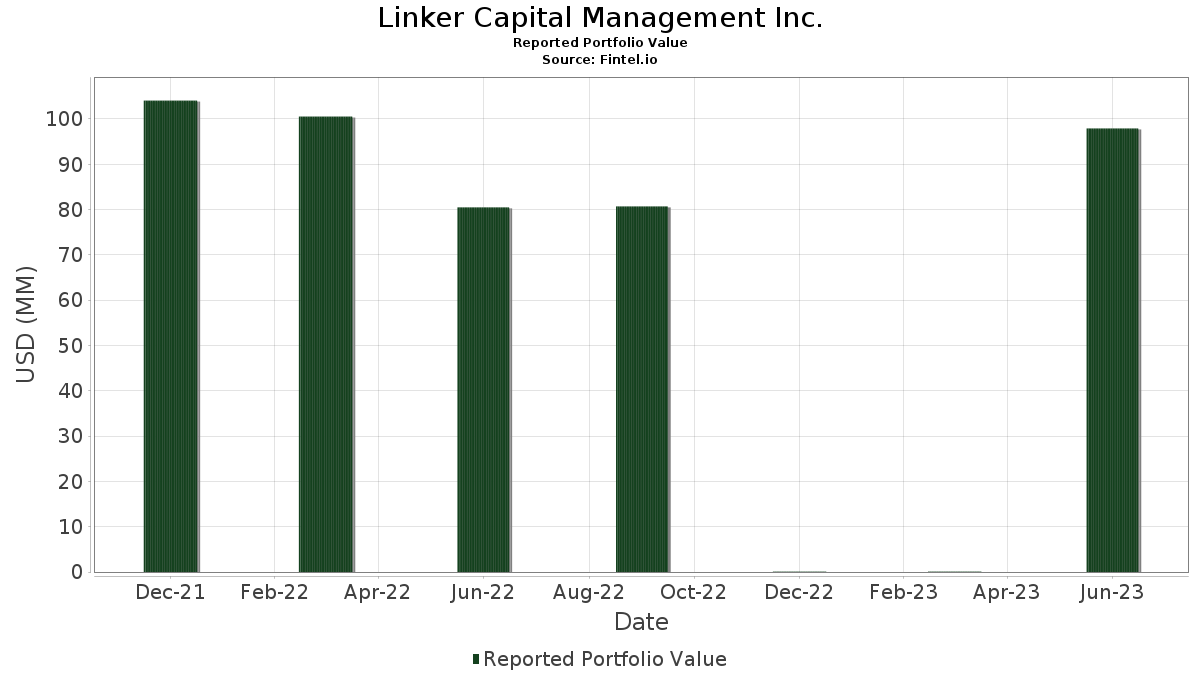
| Portfolio Value | $ 97,910,895 |
| Current Positions | 39 |
Latest Holdings, Performance, AUM (from 13F, 13D)
Linker Capital Management Inc. has disclosed 39 total holdings in their latest SEC filings. Most recent portfolio value is calculated to be $ 97,910,895 USD. Actual Assets Under Management (AUM) is this value plus cash (which is not disclosed). Linker Capital Management Inc.’s top holdings are VANGUARD 500 INDEX FUND VANGUARD 500 INDEX ADM (US:US9229087104) , SPDR S&P 500 ETF (US:SPY) , SPDR S&P MidCap 400 ETF Trust (US:MDY) , Apple Inc. (US:AAPL) , and Aflac Incorporated (US:AFL) . Linker Capital Management Inc.’s new positions include Berkshire Hathaway Inc. (US:BRK.B) , JPMorgan Chase & Co. (US:JPM) , .
Top Increases This Quarter
We use the change in the portfolio allocation because this is the most meaningful metric. Changes can be due to trades or changes in share prices.
| Security | Shares (MM) |
Value (MM$) |
Portfolio % | ΔPortfolio % |
|---|---|---|---|---|
| 0.00 | 3.11 | 3.1732 | 2.8804 | |
| 0.04 | 8.20 | 8.3778 | 0.7331 | |
| 0.02 | 1.89 | 1.9309 | 0.3138 | |
| 0.05 | 20.80 | 21.2440 | 0.2634 | |
| 0.00 | 0.19 | 0.1958 | 0.1958 | |
| 0.04 | 4.43 | 4.5275 | 0.1729 | |
| 0.02 | 2.07 | 2.1177 | 0.1684 | |
| 0.02 | 2.05 | 2.0954 | 0.1407 | |
| 0.03 | 12.34 | 12.5983 | 0.1089 | |
| 0.01 | 0.44 | 0.4481 | 0.0907 |
Top Decreases This Quarter
We use the change in the portfolio allocation because this is the most meaningful metric. Changes can be due to trades or changes in share prices.
| Security | Shares (MM) |
Value (MM$) |
Portfolio % | ΔPortfolio % |
|---|---|---|---|---|
| 0.00 | 0.29 | 0.3013 | -2.7619 | |
| 0.02 | 1.47 | 1.4984 | -0.3051 | |
| 0.02 | 10.20 | 10.4145 | -0.2857 | |
| 0.01 | 0.44 | 0.4453 | -0.2388 | |
| 0.01 | 0.43 | 0.4430 | -0.2301 | |
| 0.00 | 0.00 | 0.0000 | -0.2193 | |
| 0.01 | 0.76 | 0.7793 | -0.2107 | |
| 0.02 | 1.72 | 1.7609 | -0.2070 | |
| 0.00 | 0.43 | 0.4395 | -0.1887 | |
| 0.01 | 3.43 | 3.5034 | -0.1342 |
13F and Fund Filings
This form was filed on 2023-08-14 for the reporting period 2023-06-30. Click the link icon to see the full transaction history.
Upgrade to unlock premium data and export to Excel ![]() .
.
| Security | Type | Avg Share Price | Shares (MM) |
ΔShares (%) |
ΔShares (%) |
Value ($MM) |
Portfolio (%) |
ΔPortfolio (%) |
|
|---|---|---|---|---|---|---|---|---|---|
| US9229087104 / VANGUARD 500 INDEX FUND VANGUARD 500 INDEX ADM | 0.05 | 0.35 | 20.80 | 109,373.68 | 21.2440 | 0.2634 | |||
| SPY / SPDR S&P 500 ETF | 0.03 | 0.00 | 12.34 | 112,036.36 | 12.5983 | 0.1089 | |||
| MDY / SPDR S&P MidCap 400 ETF Trust | 0.02 | 0.00 | 10.20 | 113,188.89 | 10.4145 | -0.2857 | |||
| AAPL / Apple Inc. | 0.04 | 0.00 | 8.20 | 136,600.00 | 8.3778 | 0.7331 | |||
| AFL / Aflac Incorporated | 0.07 | 0.00 | 4.62 | 115,425.00 | 4.7201 | 0.0365 | |||
| XPRO / Expro Group Holdings N.V. | 0.04 | 0.00 | 4.43 | 147,633.33 | 4.5275 | 0.1729 | |||
| DIA / SPDR Dow Jones Industrial Average ETF Trust | 0.01 | 0.00 | 3.43 | 114,233.33 | 3.5034 | -0.1342 | |||
| ACN / Accenture plc | 0.01 | 0.00 | 3.42 | 113,733.33 | 3.4882 | 0.0205 | |||
| BRK.B / Berkshire Hathaway Inc. | 0.00 | 3.11 | 3.1732 | 2.8804 | |||||
| GOOGL / Alphabet Inc. | 0.02 | 0.00 | 2.07 | 207,200.00 | 2.1177 | 0.1684 | |||
| GOOGL / Alphabet Inc. | 0.02 | 0.00 | 2.05 | 205,000.00 | 2.0954 | 0.1407 | |||
| IWM / iShares Trust - iShares Russell 2000 ETF | 0.01 | 0.00 | 1.96 | 195,700.00 | 2.0006 | -0.0451 | |||
| ORCL / Oracle Corporation | 0.02 | 0.00 | 1.89 | 188,900.00 | 1.9309 | 0.3138 | |||
| CL / Colgate-Palmolive Company | 0.02 | 0.00 | 1.81 | 180,800.00 | 1.8483 | -0.0867 | |||
| SYY / Sysco Corporation | 0.02 | 0.00 | 1.72 | 172,300.00 | 1.7609 | -0.2070 | |||
| AXP / American Express Company | 0.01 | 0.00 | 1.68 | 168,000.00 | 1.7169 | -0.0285 | |||
| DIS / The Walt Disney Company | 0.02 | 0.00 | 1.47 | 146,600.00 | 1.4984 | -0.3051 | |||
| MRK / Merck & Co., Inc. | 0.01 | 0.00 | 1.42 | 141,500.00 | 1.4471 | 0.0153 | |||
| SCHW / The Charles Schwab Corporation | 0.02 | 0.00 | 1.22 | 121,600.00 | 1.2433 | 0.0099 | |||
| JNJ / Johnson & Johnson | 0.01 | 0.00 | 1.08 | 107,800.00 | 1.1024 | -0.0060 | |||
| VTI / Vanguard Index Funds - Vanguard Total Stock Market ETF | 0.00 | 0.00 | 0.87 | 0.8864 | 0.0050 | ||||
| ABBV / AbbVie Inc. | 0.01 | 0.00 | 0.76 | 0.7793 | -0.2107 | ||||
| IWR / iShares Trust - iShares Russell Mid-Cap ETF | 0.01 | 0.00 | 0.71 | 0.7287 | -0.0201 | ||||
| CMG / Chipotle Mexican Grill, Inc. | 0.00 | 0.00 | 0.59 | 0.6008 | 0.0855 | ||||
| US9229086940 / Vanguard Extended Market Index Admiral Shares | 0.01 | 0.35 | 0.59 | 0.5983 | -0.0046 | ||||
| BMY / Bristol-Myers Squibb Company | 0.01 | 0.00 | 0.52 | 0.5291 | -0.0859 | ||||
| VMW / Vmware Inc. - Class A | 0.00 | 0.00 | 0.51 | 0.5229 | 0.0350 | ||||
| IJR / iShares Trust - iShares Core S&P Small-Cap ETF | 0.01 | 0.00 | 0.50 | 0.5089 | -0.0217 | ||||
| GAFFX / Growth Fund Of America - Growth Fund of America - Class F-3 | 0.02 | 0.00 | 0.47 | 0.4811 | -0.0989 | ||||
| DELL / Dell Technologies Inc. | 0.01 | 0.00 | 0.44 | 0.4481 | 0.0907 | ||||
| KO / The Coca-Cola Company | 0.01 | -28.03 | 0.44 | 0.4453 | -0.2388 | ||||
| EFA / iShares Trust - iShares MSCI EAFE ETF | 0.01 | -30.36 | 0.43 | 0.4430 | -0.2301 | ||||
| ABT / Abbott Laboratories | 0.00 | -30.30 | 0.43 | 0.4395 | -0.1887 | ||||
| MSFT / Microsoft Corporation | 0.00 | 0.00 | 0.36 | 0.3722 | 0.0345 | ||||
| USB / U.S. Bancorp | 0.01 | 0.00 | 0.34 | 0.3432 | -0.0592 | ||||
| BRK.A / Berkshire Hathaway Inc. | 0.00 | 0.00 | 0.29 | 14,600.00 | 0.3013 | -2.7619 | |||
| PYPL / PayPal Holdings, Inc. | 0.00 | 0.00 | 0.29 | 0.2992 | -0.0659 | ||||
| WU / The Western Union Company | 0.02 | 0.00 | 0.26 | 0.2682 | -0.0059 | ||||
| JPM / JPMorgan Chase & Co. | 0.00 | 0.19 | 0.1958 | 0.1958 | |||||
| CB / Chubb Limited | 0.00 | -100.00 | 0.00 | 0.0000 | -0.2193 |