Basic Stats
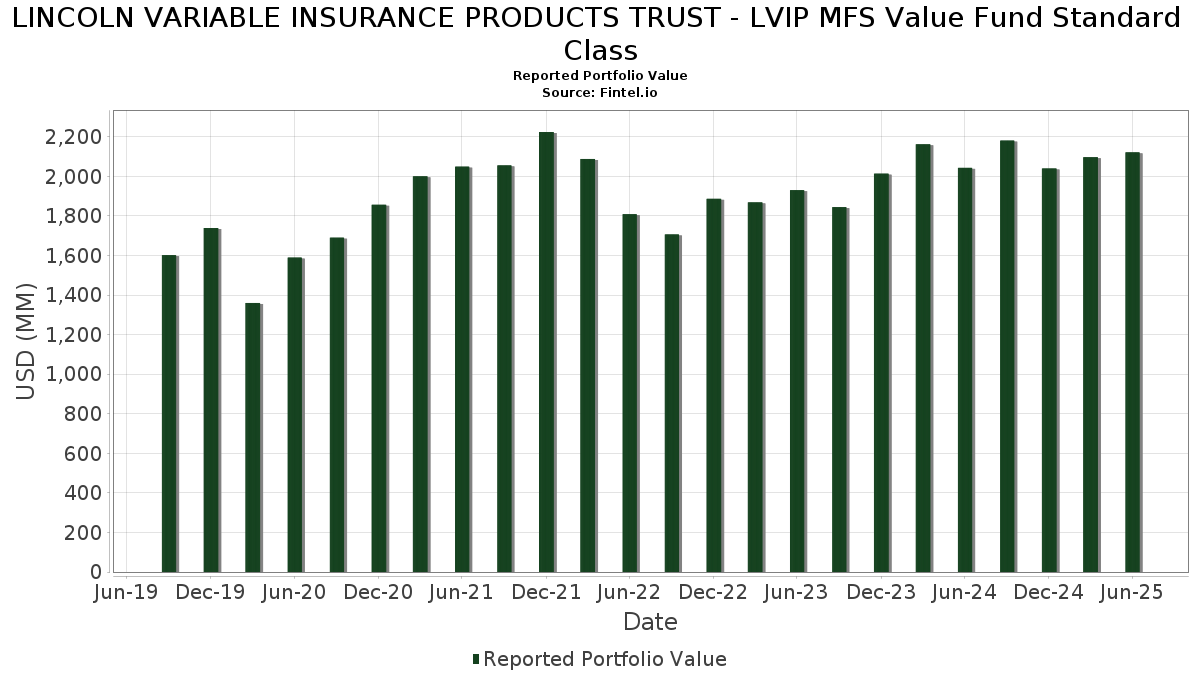
| Portfolio Value | $ 2,121,483,973 |
| Current Positions | 72 |
Latest Holdings, Performance, AUM (from 13F, 13D)
LINCOLN VARIABLE INSURANCE PRODUCTS TRUST - LVIP MFS Value Fund Standard Class has disclosed 72 total holdings in their latest SEC filings. Most recent portfolio value is calculated to be $ 2,121,483,973 USD. Actual Assets Under Management (AUM) is this value plus cash (which is not disclosed). LINCOLN VARIABLE INSURANCE PRODUCTS TRUST - LVIP MFS Value Fund Standard Class’s top holdings are JPMorgan Chase & Co. (US:JPM) , The Progressive Corporation (US:PGR) , The Cigna Group (US:CI) , McKesson Corporation (US:MCK) , and American Express Company (US:AXP) . LINCOLN VARIABLE INSURANCE PRODUCTS TRUST - LVIP MFS Value Fund Standard Class’s new positions include Federal Home Loan Bank Discount Notes (US:US313385HP48) , LPL Financial Holdings Inc. (US:LPLA) , .
Top Increases This Quarter
We use the change in the portfolio allocation because this is the most meaningful metric. Changes can be due to trades or changes in share prices.
| Security | Shares (MM) |
Value (MM$) |
Portfolio % | ΔPortfolio % |
|---|---|---|---|---|
| 28.07 | 1.3227 | 1.3227 | ||
| 0.34 | 27.39 | 1.2907 | 0.6238 | |
| 0.34 | 99.25 | 4.6768 | 0.5856 | |
| 0.29 | 39.07 | 1.8408 | 0.4239 | |
| 0.25 | 51.50 | 2.4268 | 0.3846 | |
| 0.02 | 7.41 | 0.3493 | 0.3493 | |
| 0.16 | 51.83 | 2.4422 | 0.3125 | |
| 0.03 | 29.02 | 1.3673 | 0.2945 | |
| 0.03 | 30.66 | 1.4446 | 0.2504 | |
| 0.13 | 27.81 | 1.3105 | 0.2473 |
Top Decreases This Quarter
We use the change in the portfolio allocation because this is the most meaningful metric. Changes can be due to trades or changes in share prices.
| Security | Shares (MM) |
Value (MM$) |
Portfolio % | ΔPortfolio % |
|---|---|---|---|---|
| 0.28 | 7.09 | 0.3342 | -0.4891 | |
| 0.33 | 88.02 | 4.1473 | -0.4000 | |
| 0.42 | 38.00 | 1.7903 | -0.3758 | |
| 0.22 | 47.79 | 2.2517 | -0.3466 | |
| 1.61 | 22.39 | 1.0549 | -0.2892 | |
| 0.12 | 8.27 | 0.3898 | -0.2886 | |
| 0.11 | 39.00 | 1.8377 | -0.2877 | |
| 0.87 | 18.11 | 0.8534 | -0.2668 | |
| 0.37 | 40.13 | 1.8910 | -0.2659 | |
| 0.19 | 26.98 | 1.2712 | -0.2643 |
13F and Fund Filings
This form was filed on 2025-08-06 for the reporting period 2025-06-30. Click the link icon to see the full transaction history.
Upgrade to unlock premium data and export to Excel ![]() .
.
| Security | Type | Avg Share Price | Shares (MM) |
ΔShares (%) |
ΔShares (%) |
Value ($MM) |
Portfolio (%) |
ΔPortfolio (%) |
|
|---|---|---|---|---|---|---|---|---|---|
| JPM / JPMorgan Chase & Co. | 0.34 | -2.14 | 99.25 | 15.65 | 4.6768 | 0.5856 | |||
| PGR / The Progressive Corporation | 0.33 | -2.14 | 88.02 | -7.73 | 4.1473 | -0.4000 | |||
| CI / The Cigna Group | 0.21 | -2.14 | 68.97 | -1.67 | 3.2500 | -0.0940 | |||
| MCK / McKesson Corporation | 0.09 | -11.56 | 64.90 | -3.70 | 3.0582 | -0.1546 | |||
| AXP / American Express Company | 0.16 | -2.14 | 51.83 | 16.02 | 2.4422 | 0.3125 | |||
| BA / The Boeing Company | 0.25 | -2.14 | 51.50 | 20.22 | 2.4268 | 0.3846 | |||
| RTX / RTX Corporation | 0.35 | -2.14 | 51.28 | 7.87 | 2.4161 | 0.1501 | |||
| MMC / Marsh & McLennan Companies, Inc. | 0.22 | -2.14 | 47.79 | -12.33 | 2.2517 | -0.3466 | |||
| MS / Morgan Stanley | 0.31 | -14.71 | 44.20 | 2.98 | 2.0827 | 0.0365 | |||
| JNJ / Johnson & Johnson | 0.28 | -2.14 | 42.61 | -9.87 | 2.0078 | -0.2459 | |||
| DUK / Duke Energy Corporation | 0.36 | -2.14 | 42.39 | -5.33 | 1.9975 | -0.1371 | |||
| ADI / Analog Devices, Inc. | 0.18 | -2.14 | 42.02 | 15.49 | 1.9801 | 0.2456 | |||
| NDAQ / Nasdaq, Inc. | 0.46 | -2.14 | 41.40 | 15.35 | 1.9510 | 0.2398 | |||
| GD / General Dynamics Corporation | 0.14 | -2.14 | 41.08 | 4.71 | 1.9356 | 0.0654 | |||
| XOM / Exxon Mobil Corporation | 0.37 | -2.14 | 40.13 | -11.30 | 1.8910 | -0.2659 | |||
| SO / The Southern Company | 0.43 | -2.14 | 39.18 | -2.27 | 1.8461 | -0.0650 | |||
| KKR / KKR & Co. Inc. | 0.29 | 14.22 | 39.07 | 31.43 | 1.8408 | 0.4239 | |||
| AON / Aon plc | 0.11 | -2.14 | 39.00 | -12.52 | 1.8377 | -0.2877 | |||
| TRV / The Travelers Companies, Inc. | 0.14 | -2.14 | 38.78 | -1.01 | 1.8271 | -0.0401 | |||
| COP / ConocoPhillips | 0.42 | -2.14 | 38.00 | -16.38 | 1.7903 | -0.3758 | |||
| LOW / Lowe's Companies, Inc. | 0.17 | -2.14 | 37.61 | -6.91 | 1.7720 | -0.1538 | |||
| ACN / Accenture plc | 0.12 | 10.06 | 37.17 | 5.42 | 1.7515 | 0.0706 | |||
| D / Dominion Energy, Inc. | 0.65 | 2.44 | 37.00 | 3.26 | 1.7433 | 0.0352 | |||
| CB / Chubb Limited | 0.13 | -2.14 | 36.56 | -6.12 | 1.7229 | -0.1338 | |||
| UNP / Union Pacific Corporation | 0.16 | -2.14 | 36.53 | -4.70 | 1.7215 | -0.1060 | |||
| C / Citigroup Inc. | 0.42 | -2.14 | 36.05 | 17.33 | 1.6984 | 0.2340 | |||
| HON / Honeywell International Inc. | 0.15 | -2.14 | 35.83 | 7.62 | 1.6884 | 0.1012 | |||
| PNC / The PNC Financial Services Group, Inc. | 0.19 | -2.14 | 35.76 | 3.78 | 1.6849 | 0.0425 | |||
| PLD / Prologis, Inc. | 0.32 | 8.84 | 33.45 | 2.35 | 1.5761 | 0.0182 | |||
| TXN / Texas Instruments Incorporated | 0.16 | -2.14 | 33.01 | 13.06 | 1.5555 | 0.1636 | |||
| ABT / Abbott Laboratories | 0.23 | -2.14 | 31.74 | 0.34 | 1.4954 | -0.0125 | |||
| BLK / BlackRock, Inc. | 0.03 | 10.40 | 30.66 | 22.39 | 1.4446 | 0.2504 | |||
| KLAC / KLA Corporation | 0.03 | -2.14 | 29.02 | 28.94 | 1.3673 | 0.2945 | |||
| ABBV / AbbVie Inc. | 0.15 | -2.14 | 28.77 | -13.30 | 1.3557 | -0.2264 | |||
| MAR / Marriott International, Inc. | 0.10 | -2.14 | 28.51 | 12.24 | 1.3435 | 0.1325 | |||
| US313385HP48 / Federal Home Loan Bank Discount Notes | 28.07 | 1.3227 | 1.3227 | ||||||
| NXPI / NXP Semiconductors N.V. | 0.13 | 8.47 | 27.81 | 24.70 | 1.3105 | 0.2473 | |||
| PFE / Pfizer Inc. | 1.14 | -2.14 | 27.56 | -6.39 | 1.2988 | -0.1049 | |||
| WFC / Wells Fargo & Company | 0.34 | 75.44 | 27.39 | 95.80 | 1.2907 | 0.6238 | |||
| CVX / Chevron Corporation | 0.19 | -2.14 | 26.98 | -16.24 | 1.2712 | -0.2643 | |||
| XEL / Xcel Energy Inc. | 0.36 | 25.17 | 24.66 | 20.41 | 1.1619 | 0.1857 | |||
| NOC / Northrop Grumman Corporation | 0.05 | -2.14 | 24.61 | -4.45 | 1.1597 | -0.0681 | |||
| ELV / Elevance Health, Inc. | 0.06 | -2.14 | 24.46 | -12.49 | 1.1526 | -0.1800 | |||
| NESN / Nestlé S.A. | 0.24 | -13.49 | 24.32 | -14.88 | 1.1460 | -0.2161 | |||
| ETN / Eaton Corporation plc | 0.07 | -2.14 | 23.92 | 28.51 | 1.1271 | 0.2398 | |||
| PCAR / PACCAR Inc | 0.25 | -2.14 | 23.35 | -4.47 | 1.1005 | -0.0649 | |||
| MDLZ / Mondelez International, Inc. | 0.34 | -2.14 | 22.95 | -2.74 | 1.0812 | -0.0434 | |||
| ITW / Illinois Tool Works Inc. | 0.09 | 12.85 | 22.50 | 12.50 | 1.0600 | 0.1068 | |||
| PCG / PG&E Corporation | 1.61 | -2.14 | 22.39 | -20.60 | 1.0549 | -0.2892 | |||
| PEP / PepsiCo, Inc. | 0.17 | -2.14 | 21.84 | -13.83 | 1.0289 | -0.1791 | |||
| EFX / Equifax Inc. | 0.08 | -2.14 | 21.48 | 4.21 | 1.0120 | 0.0295 | |||
| KVUE / Kenvue Inc. | 0.87 | -11.69 | 18.11 | -22.92 | 0.8534 | -0.2668 | |||
| EOG / EOG Resources, Inc. | 0.13 | -2.14 | 15.99 | -8.73 | 0.7536 | -0.0817 | |||
| MRK / Merck & Co., Inc. | 0.20 | -2.14 | 15.55 | -13.70 | 0.7328 | -0.1263 | |||
| EXC / Exelon Corporation | 0.35 | -2.14 | 15.24 | -7.79 | 0.7180 | -0.0698 | |||
| KMB / Kimberly-Clark Corporation | 0.11 | -2.15 | 13.65 | -11.29 | 0.6432 | -0.0904 | |||
| RBGPF / Reckitt Benckiser Group plc | 0.19 | -2.14 | 12.85 | -1.40 | 0.6056 | -0.0159 | |||
| TGT / Target Corporation | 0.13 | -17.31 | 12.82 | -21.84 | 0.6042 | -0.1778 | |||
| CRH / CRH plc | 0.14 | 43.09 | 12.72 | 49.31 | 0.5993 | 0.1932 | |||
| AEP / American Electric Power Company, Inc. | 0.09 | -2.14 | 9.41 | -7.08 | 0.4435 | -0.0394 | |||
| SHW / The Sherwin-Williams Company | 0.03 | -2.14 | 9.06 | -3.77 | 0.4268 | -0.0219 | |||
| CNI / Canadian National Railway Company | 0.09 | -2.15 | 8.90 | 4.46 | 0.4195 | 0.0132 | |||
| DD / DuPont de Nemours, Inc. | 0.12 | -36.71 | 8.27 | -41.87 | 0.3898 | -0.2886 | |||
| GWW / W.W. Grainger, Inc. | 0.01 | -2.16 | 7.83 | 3.03 | 0.3687 | 0.0067 | |||
| CTVA / Corteva, Inc. | 0.10 | -48.28 | 7.44 | -38.74 | 0.3507 | -0.2285 | |||
| LPLA / LPL Financial Holdings Inc. | 0.02 | 7.41 | 0.3493 | 0.3493 | |||||
| GUI / Diageo plc | 0.28 | -57.44 | 7.09 | -58.93 | 0.3342 | -0.4891 | |||
| TT / Trane Technologies plc | 0.02 | -2.14 | 6.79 | 27.06 | 0.3199 | 0.0651 | |||
| OTIS / Otis Worldwide Corporation | 0.07 | -2.14 | 6.66 | -6.10 | 0.3139 | -0.0243 | |||
| PSA / Public Storage | 0.02 | -2.14 | 6.51 | -4.07 | 0.3068 | -0.0167 | |||
| CDW / CDW Corporation | 0.03 | 39.78 | 5.77 | 55.76 | 0.2719 | 0.0953 | |||
| GVMXX / State Street Institutional Investment Trust - State Street Institutional US Govt Money Market Fnd Premier Cls | 0.02 | -99.67 | 0.02 | -99.69 | 0.0007 | -0.2277 |