Basic Stats
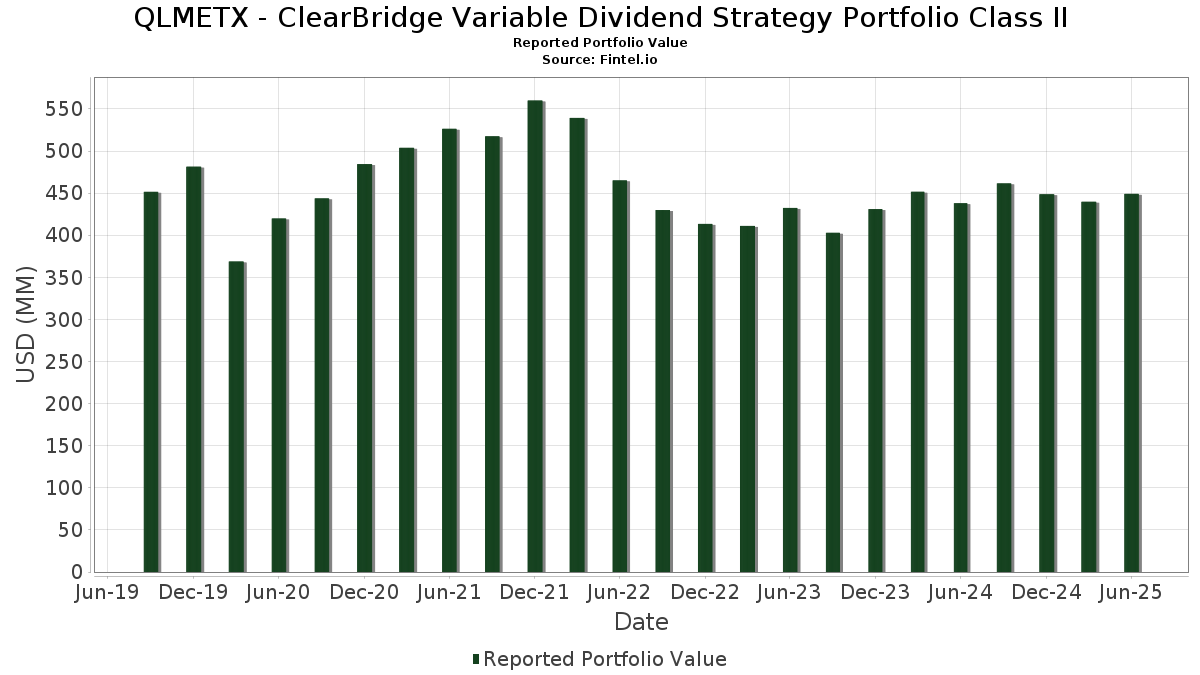
| Portfolio Value | $ 449,093,639 |
| Current Positions | 53 |
Latest Holdings, Performance, AUM (from 13F, 13D)
QLMETX - ClearBridge Variable Dividend Strategy Portfolio Class II has disclosed 53 total holdings in their latest SEC filings. Most recent portfolio value is calculated to be $ 449,093,639 USD. Actual Assets Under Management (AUM) is this value plus cash (which is not disclosed). QLMETX - ClearBridge Variable Dividend Strategy Portfolio Class II’s top holdings are Microsoft Corporation (US:MSFT) , Exxon Mobil Corporation (US:XOM) , Broadcom Inc. (US:AVGO) , Enbridge Inc. (US:ENB) , and Sempra (US:SRE) . QLMETX - ClearBridge Variable Dividend Strategy Portfolio Class II’s new positions include L3Harris Technologies, Inc. (DE:HRS) , .
Top Increases This Quarter
We use the change in the portfolio allocation because this is the most meaningful metric. Changes can be due to trades or changes in share prices.
| Security | Shares (MM) |
Value (MM$) |
Portfolio % | ΔPortfolio % |
|---|---|---|---|---|
| 0.03 | 7.46 | 1.6604 | 1.6604 | |
| 0.06 | 15.47 | 3.4451 | 1.0485 | |
| 0.04 | 20.29 | 4.5164 | 1.0190 | |
| 0.05 | 9.89 | 2.2024 | 0.7572 | |
| 0.01 | 9.16 | 2.0401 | 0.7018 | |
| 4.09 | 4.09 | 0.9112 | 0.6425 | |
| 4.09 | 4.09 | 0.9112 | 0.6425 | |
| 0.04 | 6.61 | 1.4722 | 0.5165 | |
| 0.03 | 6.03 | 1.3427 | 0.4386 | |
| 0.02 | 6.11 | 1.3612 | 0.4031 |
Top Decreases This Quarter
We use the change in the portfolio allocation because this is the most meaningful metric. Changes can be due to trades or changes in share prices.
| Security | Shares (MM) |
Value (MM$) |
Portfolio % | ΔPortfolio % |
|---|---|---|---|---|
| 0.03 | 9.03 | 2.0099 | -0.8571 | |
| 0.02 | 8.27 | 1.8414 | -0.8163 | |
| 0.04 | 10.63 | 2.3664 | -0.7473 | |
| 0.14 | 13.83 | 3.0793 | -0.7092 | |
| 0.03 | 6.54 | 1.4556 | -0.6149 | |
| 0.03 | 6.89 | 1.5332 | -0.5806 | |
| 0.03 | 4.25 | 0.9454 | -0.5728 | |
| 0.03 | 6.43 | 1.4323 | -0.4228 | |
| 0.20 | 12.58 | 2.8014 | -0.4008 | |
| 0.12 | 8.30 | 1.8471 | -0.3499 |
13F and Fund Filings
This form was filed on 2025-08-26 for the reporting period 2025-06-30. Click the link icon to see the full transaction history.
Upgrade to unlock premium data and export to Excel ![]() .
.
| Security | Type | Avg Share Price | Shares (MM) |
ΔShares (%) |
ΔShares (%) |
Value ($MM) |
Portfolio (%) |
ΔPortfolio (%) |
|
|---|---|---|---|---|---|---|---|---|---|
| MSFT / Microsoft Corporation | 0.04 | -0.34 | 20.29 | 32.05 | 4.5164 | 1.0190 | |||
| XOM / Exxon Mobil Corporation | 0.15 | 22.64 | 16.20 | 11.16 | 3.6065 | 0.2889 | |||
| AVGO / Broadcom Inc. | 0.06 | -10.72 | 15.47 | 46.99 | 3.4451 | 1.0485 | |||
| ENB / Enbridge Inc. | 0.33 | -0.35 | 14.92 | 1.93 | 3.3206 | -0.0108 | |||
| SRE / Sempra | 0.19 | -0.35 | 14.59 | 5.81 | 3.2478 | 0.1091 | |||
| NSRGY / Nestlé S.A. - Depositary Receipt (Common Stock) | 0.14 | -15.34 | 13.83 | -16.89 | 3.0793 | -0.7092 | |||
| BDX / Becton, Dickinson and Company | 0.08 | 26.57 | 12.97 | -4.83 | 2.8874 | -0.2148 | |||
| CMCSA / Comcast Corporation | 0.36 | 8.14 | 12.75 | 4.60 | 2.8380 | 0.0633 | |||
| WMB / The Williams Companies, Inc. | 0.20 | -14.89 | 12.58 | -10.54 | 2.8014 | -0.4008 | |||
| TRV / The Travelers Companies, Inc. | 0.04 | -9.50 | 11.91 | -8.44 | 2.6511 | -0.3100 | |||
| TMUS / T-Mobile US, Inc. | 0.05 | 4.63 | 11.16 | -6.53 | 2.4847 | -0.2337 | |||
| JPM / JPMorgan Chase & Co. | 0.04 | -34.24 | 10.63 | -22.29 | 2.3664 | -0.7473 | |||
| UNA / Unilever PLC | 0.17 | 3.09 | 10.33 | 5.44 | 2.3008 | 0.0694 | |||
| ORCL / Oracle Corporation | 0.05 | -0.35 | 9.89 | 55.83 | 2.2024 | 0.7572 | |||
| APO / Apollo Global Management, Inc. | 0.07 | -0.35 | 9.43 | 3.24 | 2.1004 | 0.0200 | |||
| NOC / Northrop Grumman Corporation | 0.02 | -10.27 | 9.18 | -12.38 | 2.0442 | -0.3414 | |||
| META / Meta Platforms, Inc. | 0.01 | 21.73 | 9.16 | 55.89 | 2.0401 | 0.7018 | |||
| V / Visa Inc. | 0.03 | -29.24 | 9.03 | -28.32 | 2.0099 | -0.8571 | |||
| MET / MetLife, Inc. | 0.11 | 4.38 | 9.01 | 4.56 | 2.0059 | 0.0440 | |||
| RTX / RTX Corporation | 0.06 | -17.20 | 8.55 | -8.72 | 1.9037 | -0.2290 | |||
| HLN / Haleon plc - Depositary Receipt (Common Stock) | 1.66 | -0.35 | 8.52 | 1.42 | 1.8972 | -0.0157 | |||
| AVB / AvalonBay Communities, Inc. | 0.04 | 7.74 | 8.42 | 2.16 | 1.8754 | -0.0018 | |||
| KO / The Coca-Cola Company | 0.12 | -12.97 | 8.30 | -14.03 | 1.8471 | -0.3499 | |||
| LIN / Linde plc | 0.02 | -29.69 | 8.27 | -29.15 | 1.8414 | -0.8163 | |||
| AMT / American Tower Corporation | 0.04 | 2.58 | 8.14 | 4.20 | 1.8118 | 0.0337 | |||
| VMC / Vulcan Materials Company | 0.03 | -18.58 | 7.90 | -8.98 | 1.7587 | -0.2171 | |||
| WM / Waste Management, Inc. | 0.03 | -0.35 | 7.72 | -1.50 | 1.7196 | -0.0657 | |||
| MRK / Merck & Co., Inc. | 0.09 | 9.48 | 7.51 | -3.45 | 1.6718 | -0.0989 | |||
| GOOGL / Alphabet Inc. | 0.04 | -12.77 | 7.49 | -0.60 | 1.6673 | -0.0478 | |||
| HRS / L3Harris Technologies, Inc. | 0.03 | 7.46 | 1.6604 | 1.6604 | |||||
| HD / The Home Depot, Inc. | 0.02 | 12.94 | 6.97 | 12.99 | 1.5528 | 0.1475 | |||
| COF / Capital One Financial Corporation | 0.03 | -37.50 | 6.89 | -25.84 | 1.5332 | -0.5806 | |||
| CVS / CVS Health Corporation | 0.10 | 19.68 | 6.65 | 21.84 | 1.4796 | 0.2379 | |||
| TE Connectivity PLC / EC (IE000IVNQZ81) | 0.04 | 31.98 | 6.61 | 57.50 | 1.4722 | 0.5165 | |||
| UNP / Union Pacific Corporation | 0.03 | -26.19 | 6.54 | -28.11 | 1.4556 | -0.6149 | |||
| AAPL / Apple Inc. | 0.03 | -14.52 | 6.43 | -21.05 | 1.4323 | -0.4228 | |||
| IDEXY / Industria de Diseño Textil, S.A. - Depositary Receipt (Common Stock) | 0.48 | 163.03 | 6.32 | 37.30 | 1.4062 | 0.3589 | |||
| PSA / Public Storage | 0.02 | 48.19 | 6.11 | 45.27 | 1.3612 | 0.4031 | |||
| PNC / The PNC Financial Services Group, Inc. | 0.03 | 8.91 | 6.09 | 15.51 | 1.3548 | 0.1554 | |||
| TXN / Texas Instruments Incorporated | 0.03 | 31.44 | 6.03 | 51.88 | 1.3427 | 0.4386 | |||
| AZN / Astrazeneca plc | 0.04 | -0.35 | 6.03 | -5.56 | 1.3421 | -0.1110 | |||
| DGE N / Diageo plc | 0.23 | -0.35 | 5.87 | -3.84 | 1.3058 | -0.0828 | |||
| JNJ / Johnson & Johnson | 0.04 | -0.35 | 5.75 | -8.22 | 1.2799 | -0.1460 | |||
| UNH / UnitedHealth Group Incorporated | 0.02 | 46.28 | 5.70 | -12.88 | 1.2685 | -0.2202 | |||
| FCX / Freeport-McMoRan Inc. | 0.12 | -0.35 | 5.40 | 14.11 | 1.2012 | 0.1247 | |||
| DTE / DTE Energy Company | 0.04 | -0.35 | 4.90 | -4.54 | 1.0912 | -0.0776 | |||
| DIS / The Walt Disney Company | 0.04 | 12.10 | 4.85 | 40.85 | 1.0794 | 0.2958 | |||
| EQT / EQT Corporation | 0.08 | -21.12 | 4.84 | -13.91 | 1.0773 | -0.2022 | |||
| APD / Air Products and Chemicals, Inc. | 0.02 | -10.41 | 4.35 | -14.33 | 0.9692 | -0.1875 | |||
| PG / The Procter & Gamble Company | 0.03 | -31.89 | 4.25 | -36.32 | 0.9454 | -0.5728 | |||
| JTSXX / JPMorgan Trust I. - JPMorgan 100% U.S. Treasury Securities Money Market Fund Inst | 4.09 | 246.76 | 4.09 | 246.78 | 0.9112 | 0.6425 | |||
| US52470G4780 / WA Premier Institutional U.S. Treasury Reserves-Premium Shares | 4.09 | 246.76 | 4.09 | 246.78 | 0.9112 | 0.6425 | |||
| EIX / Edison International | 0.05 | -0.35 | 2.72 | -12.72 | 0.6065 | -0.1041 |