Basic Stats
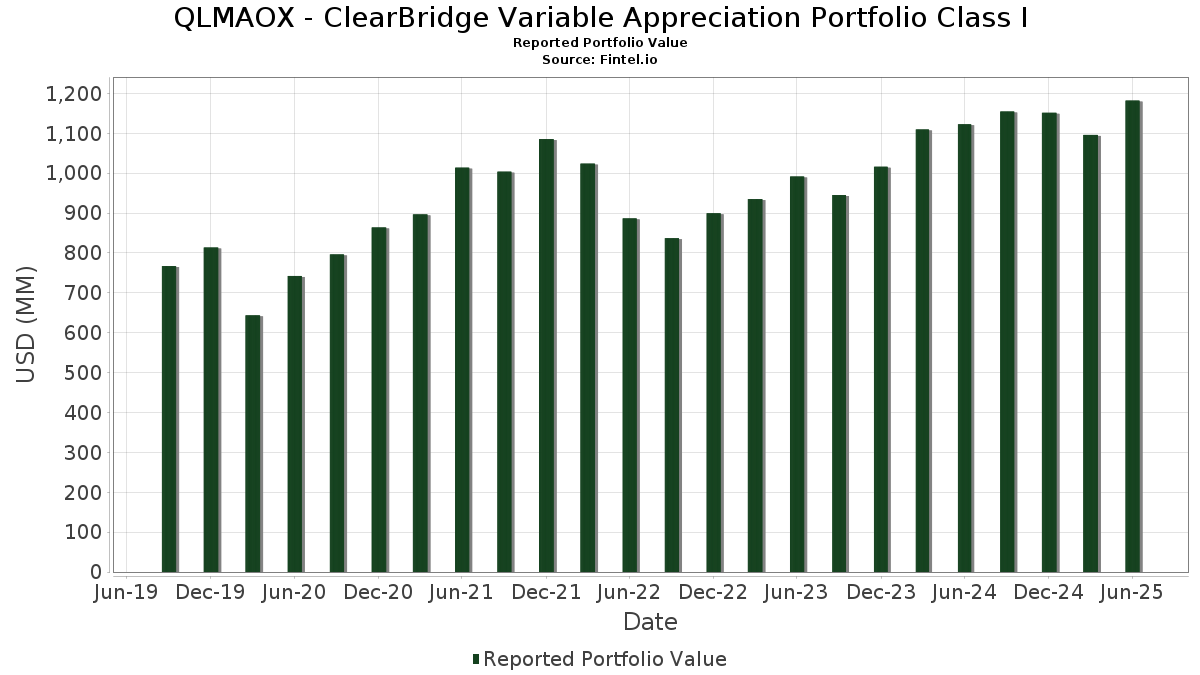
| Portfolio Value | $ 1,182,124,261 |
| Current Positions | 61 |
Latest Holdings, Performance, AUM (from 13F, 13D)
QLMAOX - ClearBridge Variable Appreciation Portfolio Class I has disclosed 61 total holdings in their latest SEC filings. Most recent portfolio value is calculated to be $ 1,182,124,261 USD. Actual Assets Under Management (AUM) is this value plus cash (which is not disclosed). QLMAOX - ClearBridge Variable Appreciation Portfolio Class I’s top holdings are Microsoft Corporation (US:MSFT) , NVIDIA Corporation (US:NVDA) , Apple Inc. (US:AAPL) , Meta Platforms, Inc. (US:META) , and Amazon.com, Inc. (US:AMZN) . QLMAOX - ClearBridge Variable Appreciation Portfolio Class I’s new positions include The Boeing Company (US:BA) , Old Dominion Freight Line, Inc. (US:ODFL) , .
Top Increases This Quarter
We use the change in the portfolio allocation because this is the most meaningful metric. Changes can be due to trades or changes in share prices.
| Security | Shares (MM) |
Value (MM$) |
Portfolio % | ΔPortfolio % |
|---|---|---|---|---|
| 0.45 | 71.10 | 6.0176 | 2.3706 | |
| 0.21 | 106.91 | 9.0481 | 1.5930 | |
| 0.07 | 48.74 | 4.1247 | 1.1808 | |
| 0.06 | 13.61 | 1.1521 | 1.1521 | |
| 0.14 | 38.33 | 3.2438 | 1.1374 | |
| 0.02 | 28.16 | 2.3830 | 0.7796 | |
| 0.04 | 8.45 | 0.7151 | 0.7151 | |
| 0.05 | 7.92 | 0.6704 | 0.6704 | |
| 0.05 | 9.59 | 0.8116 | 0.5604 | |
| 0.07 | 23.85 | 2.0183 | 0.3408 |
Top Decreases This Quarter
We use the change in the portfolio allocation because this is the most meaningful metric. Changes can be due to trades or changes in share prices.
| Security | Shares (MM) |
Value (MM$) |
Portfolio % | ΔPortfolio % |
|---|---|---|---|---|
| 0.24 | 49.56 | 4.1941 | -0.7634 | |
| 0.00 | 34.25 | 2.8989 | -0.5992 | |
| 0.03 | 21.53 | 1.8222 | -0.5533 | |
| 0.09 | 32.29 | 2.7326 | -0.5275 | |
| 0.02 | 8.80 | 0.7444 | -0.5025 | |
| 0.19 | 23.31 | 1.9731 | -0.3741 | |
| 0.20 | 43.65 | 3.6944 | -0.3351 | |
| 0.03 | 8.03 | 0.6800 | -0.2985 | |
| 0.03 | 11.45 | 0.9693 | -0.2868 | |
| 0.08 | 14.29 | 1.2090 | -0.2807 |
13F and Fund Filings
This form was filed on 2025-08-26 for the reporting period 2025-06-30. Click the link icon to see the full transaction history.
Upgrade to unlock premium data and export to Excel ![]() .
.
| Security | Type | Avg Share Price | Shares (MM) |
ΔShares (%) |
ΔShares (%) |
Value ($MM) |
Portfolio (%) |
ΔPortfolio (%) |
|
|---|---|---|---|---|---|---|---|---|---|
| MSFT / Microsoft Corporation | 0.21 | -1.22 | 106.91 | 30.89 | 9.0481 | 1.5930 | |||
| NVDA / NVIDIA Corporation | 0.45 | 22.07 | 71.10 | 77.96 | 6.0176 | 2.3706 | |||
| AAPL / Apple Inc. | 0.24 | -1.22 | 49.56 | -8.76 | 4.1941 | -0.7634 | |||
| META / Meta Platforms, Inc. | 0.07 | 18.00 | 48.74 | 51.11 | 4.1247 | 1.1808 | |||
| AMZN / Amazon.com, Inc. | 0.20 | -14.25 | 43.65 | -1.12 | 3.6944 | -0.3351 | |||
| JPM / JPMorgan Chase & Co. | 0.14 | -1.21 | 39.83 | 16.75 | 3.3711 | 0.2572 | |||
| AVGO / Broadcom Inc. | 0.14 | 0.88 | 38.33 | 66.08 | 3.2438 | 1.1374 | |||
| BRK.A / Berkshire Hathaway Inc. | 0.00 | -2.08 | 34.25 | -10.62 | 2.8989 | -0.5992 | |||
| V / Visa Inc. | 0.09 | -10.77 | 32.29 | -9.60 | 2.7326 | -0.5275 | |||
| WMT / Walmart Inc. | 0.30 | -1.22 | 28.86 | 10.03 | 2.4426 | 0.0483 | |||
| NFLX / Netflix, Inc. | 0.02 | 11.62 | 28.16 | 60.28 | 2.3830 | 0.7796 | |||
| BAC / Bank of America Corporation | 0.58 | -1.22 | 27.51 | 12.01 | 2.3279 | 0.0865 | |||
| ETN / Eaton Corporation plc | 0.07 | -1.19 | 23.85 | 29.76 | 2.0183 | 0.3408 | |||
| TJX / The TJX Companies, Inc. | 0.19 | -10.58 | 23.31 | -9.34 | 1.9731 | -0.3741 | |||
| TRV / The Travelers Companies, Inc. | 0.09 | -5.81 | 23.16 | -4.71 | 1.9598 | -0.2583 | |||
| LLY / Eli Lilly and Company | 0.03 | -12.35 | 21.53 | -17.27 | 1.8222 | -0.5533 | |||
| HON / Honeywell International Inc. | 0.09 | -1.20 | 20.96 | 8.66 | 1.7736 | 0.0132 | |||
| DIS / The Walt Disney Company | 0.16 | -1.21 | 20.29 | 24.12 | 1.7171 | 0.2251 | |||
| GOOGL / Alphabet Inc. | 0.11 | -6.83 | 20.01 | 6.18 | 1.6936 | -0.0267 | |||
| ADP / Automatic Data Processing, Inc. | 0.06 | -6.24 | 19.50 | -5.36 | 1.6503 | -0.2303 | |||
| ASML / ASML Holding N.V. - Depositary Receipt (Common Stock) | 0.02 | 13.03 | 18.82 | 36.69 | 1.5925 | 0.3360 | |||
| WM / Waste Management, Inc. | 0.08 | -1.20 | 18.70 | -2.34 | 1.5829 | -0.1653 | |||
| PG / The Procter & Gamble Company | 0.11 | 40.94 | 17.55 | 31.76 | 1.4851 | 0.2695 | |||
| SNPS / Synopsys, Inc. | 0.03 | -1.16 | 16.73 | 18.16 | 1.4156 | 0.1235 | |||
| VMC / Vulcan Materials Company | 0.06 | -1.19 | 16.12 | 10.46 | 1.3646 | 0.0323 | |||
| JNJ / Johnson & Johnson | 0.10 | -1.21 | 16.01 | -9.01 | 1.3546 | -0.2509 | |||
| EMR / Emerson Electric Co. | 0.12 | 12.96 | 15.76 | 37.37 | 1.3340 | 0.2867 | |||
| XOM / Exxon Mobil Corporation | 0.14 | -1.21 | 15.36 | -10.46 | 1.2998 | -0.2657 | |||
| LIN / Linde plc | 0.03 | 19.49 | 14.98 | 20.40 | 1.2679 | 0.1321 | |||
| RTX / RTX Corporation | 0.10 | -1.21 | 14.93 | 8.91 | 1.2632 | 0.0123 | |||
| ABBV / AbbVie Inc. | 0.08 | -1.20 | 14.29 | -12.47 | 1.2090 | -0.2807 | |||
| KO / The Coca-Cola Company | 0.20 | -1.22 | 13.90 | -2.41 | 1.1768 | -0.1238 | |||
| BA / The Boeing Company | 0.06 | 13.61 | 1.1521 | 1.1521 | |||||
| JTSXX / JPMorgan Trust I. - JPMorgan 100% U.S. Treasury Securities Money Market Fund Inst | 13.27 | -3.63 | 13.27 | -3.62 | 1.1230 | -0.1337 | |||
| US52470G4780 / WA Premier Institutional U.S. Treasury Reserves-Premium Shares | 13.27 | -3.63 | 13.27 | -3.62 | 1.1230 | -0.1337 | |||
| ICE / Intercontinental Exchange, Inc. | 0.07 | -9.54 | 12.93 | -3.79 | 1.0939 | -0.1323 | |||
| ETR / Entergy Corporation | 0.15 | 4.60 | 12.64 | 1.71 | 1.0697 | -0.0646 | |||
| AMT / American Tower Corporation | 0.06 | -12.76 | 12.18 | -11.39 | 1.0308 | -0.2237 | |||
| ECL / Ecolab Inc. | 0.04 | -1.18 | 11.92 | 5.02 | 1.0088 | -0.0271 | |||
| GOOG / Alphabet Inc. | 0.07 | -17.45 | 11.81 | -6.27 | 0.9995 | -0.1506 | |||
| SYK / Stryker Corporation | 0.03 | -21.70 | 11.45 | -16.78 | 0.9693 | -0.2868 | |||
| TMUS / T-Mobile US, Inc. | 0.05 | 75.16 | 11.00 | 56.47 | 0.9312 | 0.2894 | |||
| MKC / McCormick & Company, Incorporated | 0.14 | -1.21 | 10.55 | -9.00 | 0.8932 | -0.1654 | |||
| KMI / Kinder Morgan, Inc. | 0.35 | -15.74 | 10.41 | -13.17 | 0.8812 | -0.2133 | |||
| TXN / Texas Instruments Incorporated | 0.05 | 229.47 | 9.59 | 272.86 | 0.8116 | 0.5604 | |||
| CCK / Crown Holdings, Inc. | 0.09 | -1.20 | 9.48 | 13.97 | 0.8021 | 0.0432 | |||
| SHW / The Sherwin-Williams Company | 0.03 | -1.14 | 9.01 | -2.80 | 0.7629 | -0.0835 | |||
| TMO / Thermo Fisher Scientific Inc. | 0.02 | -20.98 | 8.80 | -35.62 | 0.7444 | -0.5025 | |||
| PANW / Palo Alto Networks, Inc. | 0.04 | 8.45 | 0.7151 | 0.7151 | |||||
| PGR / The Progressive Corporation | 0.03 | -20.52 | 8.03 | -25.06 | 0.6800 | -0.2985 | |||
| ODFL / Old Dominion Freight Line, Inc. | 0.05 | 7.92 | 0.6704 | 0.6704 | |||||
| CVX / Chevron Corporation | 0.06 | -1.19 | 7.91 | -15.43 | 0.6694 | -0.1842 | |||
| TSLA / Tesla, Inc. | 0.02 | -1.13 | 7.36 | 21.18 | 0.6232 | 0.0686 | |||
| ORCL / Oracle Corporation | 0.03 | -51.18 | 7.24 | -23.67 | 0.6131 | -0.2531 | |||
| EQT / EQT Corporation | 0.11 | -1.21 | 6.65 | 7.83 | 0.5632 | -0.0001 | |||
| BJ / BJ's Wholesale Club Holdings, Inc. | 0.06 | -1.19 | 6.34 | -6.63 | 0.5364 | -0.0831 | |||
| CME / CME Group Inc. | 0.02 | -10.38 | 6.06 | -6.90 | 0.5131 | -0.0812 | |||
| CP / Canadian Pacific Kansas City Limited | 0.08 | -1.20 | 6.06 | 11.56 | 0.5131 | 0.0170 | |||
| UNP / Union Pacific Corporation | 0.02 | -1.14 | 5.37 | -3.71 | 0.4541 | -0.0545 | |||
| SBUX / Starbucks Corporation | 0.06 | -1.19 | 5.23 | -7.68 | 0.4423 | -0.0745 | |||
| WEC / WEC Energy Group, Inc. | 0.03 | -1.14 | 2.61 | -5.47 | 0.2209 | -0.0312 |