Basic Stats
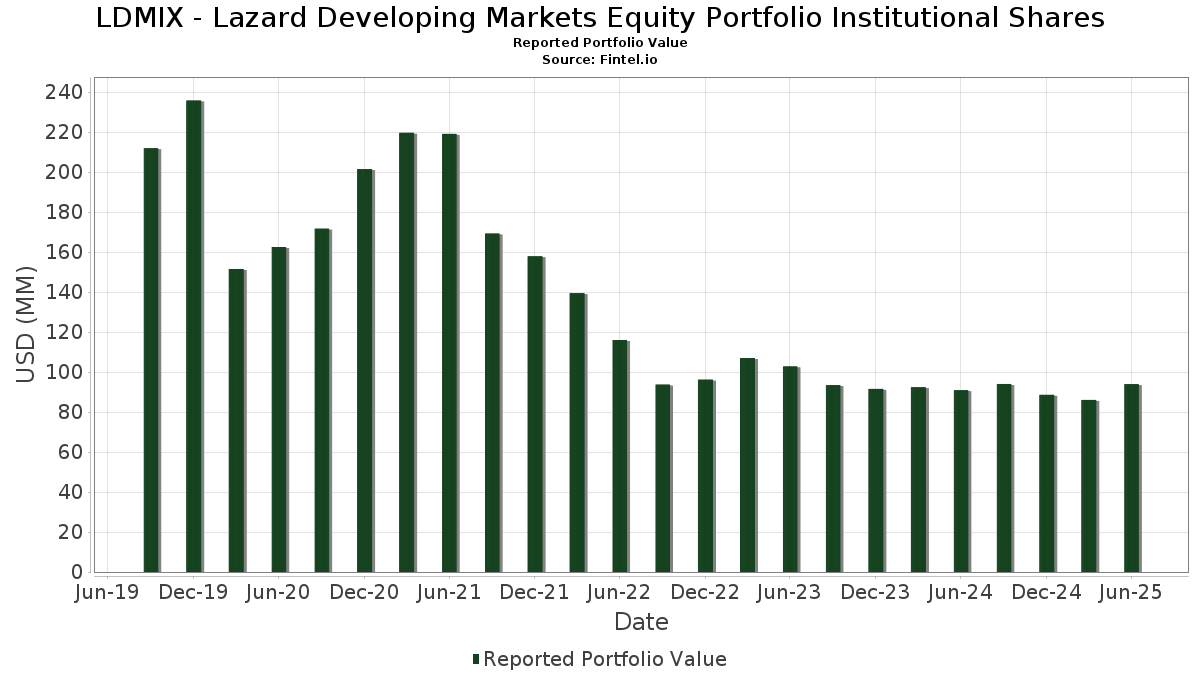
| Portfolio Value | $ 93,953,263 |
| Current Positions | 65 |
Latest Holdings, Performance, AUM (from 13F, 13D)
LDMIX - Lazard Developing Markets Equity Portfolio Institutional Shares has disclosed 65 total holdings in their latest SEC filings. Most recent portfolio value is calculated to be $ 93,953,263 USD. Actual Assets Under Management (AUM) is this value plus cash (which is not disclosed). LDMIX - Lazard Developing Markets Equity Portfolio Institutional Shares’s top holdings are Taiwan Semiconductor Manufacturing Company Limited (TW:2330) , Tencent Holdings Limited (DE:NNND) , Samsung Electronics Co., Ltd. (KR:005930) , SK hynix Inc. (KR:000660) , and Alibaba Group Holding Limited (DE:2RR) . LDMIX - Lazard Developing Markets Equity Portfolio Institutional Shares’s new positions include Sea Limited - Depositary Receipt (Common Stock) (US:SE) , Bharti Airtel Limited (IN:BHARTIARTL) , Rede D'Or São Luiz S.A. (BR:RDOR3) , Jerónimo Martins, SGPS, S.A. (GB:0EXG) , and Shenzhen Mindray Bio-Medical Electronics Co., Ltd. (CN:300760) .
Top Increases This Quarter
We use the change in the portfolio allocation because this is the most meaningful metric. Changes can be due to trades or changes in share prices.
| Security | Shares (MM) |
Value (MM$) |
Portfolio % | ΔPortfolio % |
|---|---|---|---|---|
| 1.82 | 1.9438 | 1.9438 | ||
| 0.30 | 10.94 | 11.6841 | 1.6055 | |
| 0.12 | 1.29 | 1.3804 | 1.3804 | |
| 0.01 | 1.18 | 1.2553 | 1.2553 | |
| 0.04 | 0.97 | 1.0374 | 1.0374 | |
| 0.15 | 0.97 | 1.0340 | 1.0340 | |
| 0.04 | 0.96 | 1.0287 | 1.0287 | |
| 0.02 | 0.68 | 0.7236 | 0.7236 | |
| 0.06 | 1.59 | 1.6975 | 0.6965 | |
| 0.02 | 1.08 | 1.1578 | 0.4561 |
Top Decreases This Quarter
We use the change in the portfolio allocation because this is the most meaningful metric. Changes can be due to trades or changes in share prices.
| Security | Shares (MM) |
Value (MM$) |
Portfolio % | ΔPortfolio % |
|---|---|---|---|---|
| 0.05 | 0.82 | 0.8756 | -0.7749 | |
| 0.22 | 3.08 | 3.2860 | -0.6268 | |
| 0.08 | 5.31 | 5.6728 | -0.6098 | |
| 0.05 | 0.81 | 0.8608 | -0.6081 | |
| 0.01 | 0.64 | 0.6812 | -0.4466 | |
| 0.64 | 1.03 | 1.1023 | -0.3952 | |
| 6.59 | 1.52 | 1.6265 | -0.2730 | |
| 0.01 | 1.78 | 1.9053 | -0.2549 | |
| 0.13 | 1.62 | 1.7291 | -0.2304 | |
| 0.82 | 2.22 | 2.3720 | -0.2249 |
13F and Fund Filings
This form was filed on 2025-08-21 for the reporting period 2025-06-30. Click the link icon to see the full transaction history.
Upgrade to unlock premium data and export to Excel ![]() .
.
| Security | Type | Avg Share Price | Shares (MM) |
ΔShares (%) |
ΔShares (%) |
Value ($MM) |
Portfolio (%) |
ΔPortfolio (%) |
|
|---|---|---|---|---|---|---|---|---|---|
| 2330 / Taiwan Semiconductor Manufacturing Company Limited | 0.30 | -2.57 | 10.94 | 26.20 | 11.6841 | 1.6055 | |||
| NNND / Tencent Holdings Limited | 0.08 | -2.48 | 5.31 | -1.72 | 5.6728 | -0.6098 | |||
| 005930 / Samsung Electronics Co., Ltd. | 0.09 | -2.52 | 3.83 | 9.11 | 4.0933 | 0.0106 | |||
| 000660 / SK hynix Inc. | 0.02 | -24.98 | 3.49 | 22.55 | 3.7320 | 0.4171 | |||
| 2RR / Alibaba Group Holding Limited | 0.22 | 6.80 | 3.08 | -8.59 | 3.2860 | -0.6268 | |||
| HDB / HDFC Bank Limited - Depositary Receipt (Common Stock) | 0.04 | -2.52 | 2.86 | 12.48 | 3.0518 | 0.0988 | |||
| TOTS3 / TOTVS S.A. | 0.33 | -2.55 | 2.55 | 29.49 | 2.7249 | 0.4340 | |||
| MELI / MercadoLibre, Inc. | 0.00 | -2.49 | 2.35 | 30.67 | 2.5122 | 0.4190 | |||
| BDO / BDO Unibank, Inc. | 0.82 | -1.85 | 2.22 | -0.58 | 2.3720 | -0.2249 | |||
| IBN / ICICI Bank Limited - Depositary Receipt (Common Stock) | 0.06 | -2.52 | 2.03 | 4.06 | 2.1630 | -0.1000 | |||
| FIXED INC CLEARING CORP.REPO / RA (000000000) | 1.82 | 1.9438 | 1.9438 | ||||||
| CKHGF / Capitec Bank Holdings Limited | 0.01 | -18.91 | 1.78 | -4.04 | 1.9053 | -0.2549 | |||
| 4FN / Grupo Financiero Banorte, S.A.B. de C.V. | 0.20 | -11.11 | 1.78 | 17.15 | 1.9052 | 0.1351 | |||
| LHL / Lenovo Group Limited | 1.39 | 24.24 | 1.68 | 10.11 | 1.7916 | 0.0212 | |||
| 2454 / MediaTek Inc. | 0.04 | -2.50 | 1.66 | -1.54 | 1.7734 | -0.1873 | |||
| 3711 / ASE Technology Holding Co., Ltd. | 0.32 | -2.70 | 1.62 | 11.23 | 1.7352 | 0.0375 | |||
| SKC2 / Standard Bank Group Limited | 0.13 | -2.52 | 1.62 | -3.98 | 1.7291 | -0.2304 | |||
| 3665 / Bizlink Holding Inc. | 0.06 | -1.78 | 1.59 | 84.55 | 1.6975 | 0.6965 | |||
| BBRI / PT Bank Rakyat Indonesia (Persero) Tbk | 6.59 | -2.52 | 1.52 | -6.85 | 1.6265 | -0.2730 | |||
| 1810 / Xiaomi Corporation | 0.18 | -2.62 | 1.37 | 18.14 | 1.4684 | 0.1159 | |||
| RELIANCE / Reliance Industries Limited | 0.08 | 25.81 | 1.37 | 48.00 | 1.4597 | 0.3866 | |||
| BAJFINANCE / Bajaj Finance Limited | 0.12 | 1.29 | 1.3804 | 1.3804 | |||||
| PRIO3 / Prio S.A. | 0.16 | -2.56 | 1.28 | 9.07 | 1.3619 | 0.0022 | |||
| PZX / Ping An Insurance (Group) Company of China, Ltd. | 0.20 | -2.69 | 1.27 | 3.77 | 1.3531 | -0.0653 | |||
| 601138 / Foxconn Industrial Internet Co., Ltd. | 0.40 | -2.55 | 1.20 | 4.82 | 1.2784 | -0.0497 | |||
| SE / Sea Limited - Depositary Receipt (Common Stock) | 0.01 | 1.18 | 1.2553 | 1.2553 | |||||
| PBCRY / PT Bank Central Asia Tbk - Depositary Receipt (Common Stock) | 2.18 | -2.53 | 1.17 | 2.54 | 1.2498 | -0.0767 | |||
| AC / Arca Continental, S.A.B. de C.V. | 0.11 | 39.69 | 1.13 | 41.25 | 1.2078 | 0.2768 | |||
| MPHASIS / Mphasis Limited | 0.03 | -2.52 | 1.09 | 11.57 | 1.1651 | 0.0290 | |||
| 000120 / CJ Logistics Corporation | 0.02 | 63.63 | 1.08 | 79.77 | 1.1578 | 0.4561 | |||
| D8V / Credicorp Ltd. | 0.00 | -2.51 | 1.05 | 17.09 | 1.1201 | 0.0785 | |||
| 1585 / Yadea Group Holdings Ltd. | 0.64 | -2.72 | 1.03 | -19.88 | 1.1023 | -0.3952 | |||
| 300124 / Shenzhen Inovance Technology Co.,Ltd | 0.11 | -2.52 | 1.02 | -6.35 | 1.0864 | -0.1768 | |||
| 1590 / Airtac International Group | 0.03 | -2.96 | 0.97 | 13.57 | 1.0380 | 0.0436 | |||
| BHARTIARTL / Bharti Airtel Limited | 0.04 | 0.97 | 1.0374 | 1.0374 | |||||
| MMYT / MakeMyTrip Limited | 0.01 | 0.00 | 0.97 | 0.00 | 1.0364 | -0.0913 | |||
| RDOR3 / Rede D'Or São Luiz S.A. | 0.15 | 0.97 | 1.0340 | 1.0340 | |||||
| BIMAS / BIM Birlesik Magazalar A.S. | 0.08 | 46.09 | 0.96 | 51.57 | 1.0302 | 0.2899 | |||
| 0EXG / Jerónimo Martins, SGPS, S.A. | 0.04 | 0.96 | 1.0287 | 1.0287 | |||||
| SN / SharkNinja, Inc. | 0.01 | -21.40 | 0.95 | -6.69 | 1.0137 | -0.1691 | |||
| ICT / International Container Terminal Services, Inc. | 0.13 | -2.53 | 0.93 | 14.83 | 0.9925 | 0.0521 | |||
| 2049 / Hiwin Technologies Corporation | 0.13 | 38.41 | 0.93 | 34.74 | 0.9904 | 0.1897 | |||
| 2360 / Chroma ATE Inc. | 0.06 | -1.69 | 0.87 | 69.38 | 0.9345 | 0.3342 | |||
| 3533 / Lotes Co., Ltd. | 0.02 | 0.00 | 0.86 | 8.88 | 0.9169 | 0.0009 | |||
| INPST / InPost S.A. | 0.05 | -48.85 | 0.82 | -42.28 | 0.8756 | -0.7749 | |||
| BY6 / BYD Company Limited | 0.05 | 106.00 | 0.81 | -36.18 | 0.8608 | -0.6081 | |||
| UPL / UPL Limited | 0.10 | -2.52 | 0.80 | 1.52 | 0.8547 | -0.0623 | |||
| TW0005388003 / SERCOMM | 0.24 | -2.85 | 0.78 | -10.56 | 0.8321 | -0.1814 | |||
| PAGS / PagSeguro Digital Ltd. | 0.08 | -2.52 | 0.77 | 23.16 | 0.8242 | 0.0958 | |||
| 425 / Minth Group Limited | 0.26 | -16.67 | 0.74 | 18.47 | 0.7948 | 0.1143 | |||
| RAIL3 / Rumo S.A. | 0.22 | -2.56 | 0.74 | 16.96 | 0.7888 | 0.0544 | |||
| 3606 / Fuyao Glass Industry Group Co., Ltd. | 0.10 | -2.43 | 0.69 | -2.41 | 0.7361 | -0.0855 | |||
| 300760 / Shenzhen Mindray Bio-Medical Electronics Co., Ltd. | 0.02 | 0.68 | 0.7236 | 0.7236 | |||||
| HY7 / Shoprite Holdings Ltd | 0.04 | -2.52 | 0.67 | 2.75 | 0.7180 | -0.0429 | |||
| TS / Tenaris S.A. - Depositary Receipt (Common Stock) | 0.02 | -2.52 | 0.67 | -6.82 | 0.7161 | -0.1201 | |||
| EPAM / EPAM Systems, Inc. | 0.00 | -2.53 | 0.66 | 2.18 | 0.6997 | -0.0464 | |||
| TFG / The Foschini Group Limited | 0.09 | -2.52 | 0.64 | 4.76 | 0.6823 | -0.0261 | |||
| 9961 / Trip.com Group Limited | 0.01 | -27.96 | 0.64 | -34.33 | 0.6812 | -0.4466 | |||
| 300750 / Contemporary Amperex Technology Co., Limited | 0.02 | -2.69 | 0.64 | -2.15 | 0.6805 | -0.0773 | |||
| 2449 / King Yuan Electronics Co., Ltd. | 0.18 | -3.23 | 0.63 | 25.25 | 0.6685 | 0.0880 | |||
| 300274 / Sungrow Power Supply Co., Ltd. | 0.07 | -2.52 | 0.62 | -4.17 | 0.6629 | -0.0899 | |||
| DXCO3 / Dexco S.A. | 0.52 | -2.55 | 0.54 | 7.95 | 0.5803 | -0.0052 | |||
| 4968 / RichWave Technology Corporation | 0.10 | -3.85 | 0.40 | -19.15 | 0.4290 | -0.1485 | |||
| VAMO3 / Vamos Locação de Caminhões, Máquinas e Equipamentos S.A. | 0.40 | -2.56 | 0.31 | -2.52 | 0.3318 | -0.0388 | |||
| TPVXX / State Street Institutional Investment Trust - State Street Institutional Treasury Plus Fund Investment Class | 0.10 | 2.48 | 0.10 | 3.23 | 0.1029 | -0.0064 |