Basic Stats
| Portfolio Value | $ 2,444,602,313 |
| Current Positions | 44 |
Latest Holdings, Performance, AUM (from 13F, 13D)
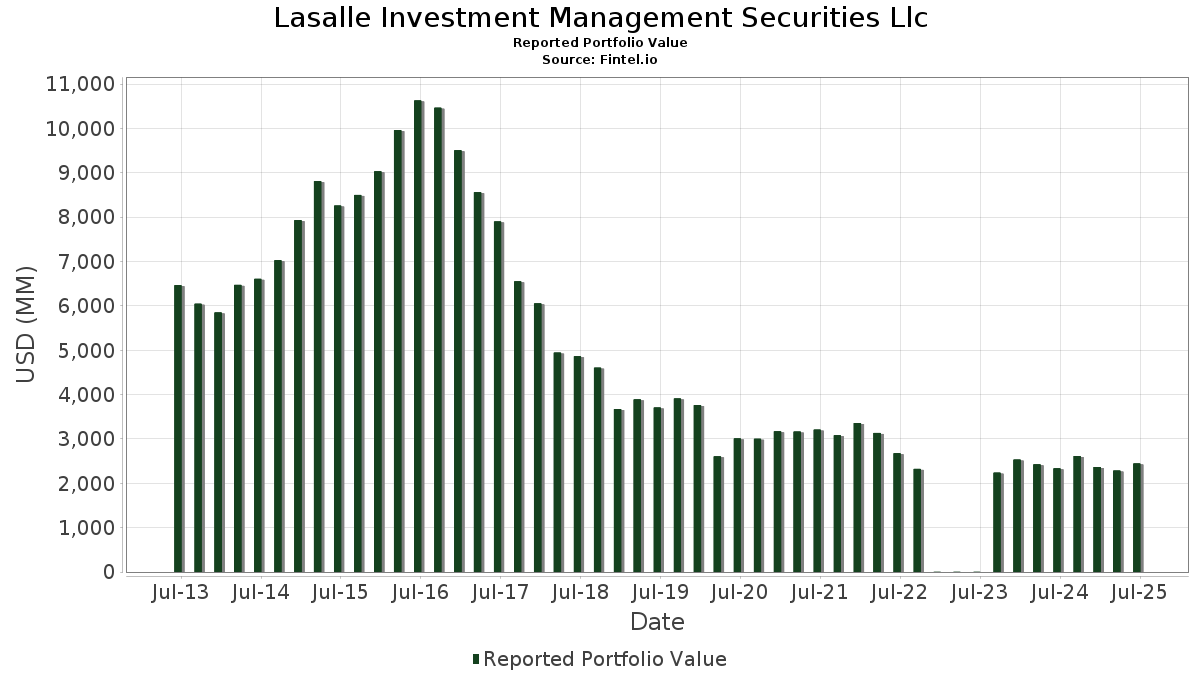
Lasalle Investment Management Securities Llc has disclosed 44 total holdings in their latest SEC filings. Most recent portfolio value is calculated to be $ 2,444,602,313 USD. Actual Assets Under Management (AUM) is this value plus cash (which is not disclosed). Lasalle Investment Management Securities Llc’s top holdings are Equinix, Inc. (US:EQIX) , Welltower Inc. (US:WELL) , Prologis, Inc. (US:PLD) , Realty Income Corporation (US:O) , and Public Storage (US:PSA) .
Top Increases This Quarter
We use the change in the portfolio allocation because this is the most meaningful metric. Changes can be due to trades or changes in share prices.
| Security | Shares (MM) |
Value (MM$) |
Portfolio % | ΔPortfolio % |
|---|---|---|---|---|
| 2.31 | 84.77 | 3.4675 | 2.0154 | |
| 0.30 | 28.15 | 1.1517 | 1.0855 | |
| 1.18 | 85.37 | 3.4922 | 0.9769 | |
| 6.21 | 103.32 | 4.2265 | 0.9519 | |
| 9.18 | 75.81 | 3.1011 | 0.6950 | |
| 0.30 | 236.95 | 9.6929 | 0.6801 | |
| 0.75 | 94.42 | 3.8622 | 0.5692 | |
| 1.16 | 26.49 | 1.0835 | 0.4454 | |
| 3.93 | 64.06 | 2.6206 | 0.3836 | |
| 0.53 | 91.74 | 3.7527 | 0.3462 |
Top Decreases This Quarter
We use the change in the portfolio allocation because this is the most meaningful metric. Changes can be due to trades or changes in share prices.
| Security | Shares (MM) |
Value (MM$) |
Portfolio % | ΔPortfolio % |
|---|---|---|---|---|
| 0.26 | 5.50 | 0.2249 | -1.2783 | |
| 0.13 | 7.94 | 0.3248 | -0.8931 | |
| 1.38 | 145.10 | 5.9354 | -0.6544 | |
| 1.16 | 78.03 | 3.1919 | -0.6517 | |
| 2.05 | 118.29 | 4.8389 | -0.6368 | |
| 1.15 | 46.87 | 1.9174 | -0.5685 | |
| 2.35 | 76.76 | 3.1400 | -0.4791 | |
| 1.02 | 23.00 | 0.9407 | -0.3758 | |
| 1.64 | 59.18 | 2.4208 | -0.3228 | |
| 0.31 | 63.23 | 2.5867 | -0.3098 |
13F and Fund Filings
This form was filed on 2025-08-12 for the reporting period 2025-06-30. Click the link icon to see the full transaction history.
Upgrade to unlock premium data and export to Excel ![]() .
.
| Security | Type | Avg Share Price | Shares (MM) |
ΔShares (%) |
ΔShares (%) |
Value ($MM) |
Portfolio (%) |
ΔPortfolio (%) |
|
|---|---|---|---|---|---|---|---|---|---|
| EQIX / Equinix, Inc. | 0.30 | 17.95 | 236.95 | 15.08 | 9.6929 | 0.6801 | |||
| WELL / Welltower Inc. | 1.42 | 9.37 | 218.68 | 9.74 | 8.9455 | 0.2235 | |||
| PLD / Prologis, Inc. | 1.38 | 2.49 | 145.10 | -3.63 | 5.9354 | -0.6544 | |||
| O / Realty Income Corporation | 2.05 | -4.79 | 118.29 | -5.44 | 4.8389 | -0.6368 | |||
| PSA / Public Storage | 0.39 | 6.68 | 115.48 | 4.59 | 4.7241 | -0.1091 | |||
| AMT / American Tower Corporation | 0.48 | 1.00 | 105.32 | 2.58 | 4.3082 | -0.1855 | |||
| COLD / Americold Realty Trust, Inc. | 6.21 | 78.22 | 103.32 | 38.11 | 4.2265 | 0.9519 | |||
| SUI / Sun Communities, Inc. | 0.75 | 27.63 | 94.42 | 25.50 | 3.8622 | 0.5692 | |||
| DLR / Digital Realty Trust, Inc. | 0.53 | -3.11 | 91.74 | 17.87 | 3.7527 | 0.3462 | |||
| ARE / Alexandria Real Estate Equities, Inc. | 1.18 | 89.22 | 85.37 | 48.56 | 3.4922 | 0.9769 | |||
| OHI / Omega Healthcare Investors, Inc. | 2.31 | 165.48 | 84.77 | 155.51 | 3.4675 | 2.0154 | |||
| SPG / Simon Property Group, Inc. | 0.51 | 10.82 | 82.64 | 7.27 | 3.3805 | 0.0085 | |||
| GLPI / Gaming and Leisure Properties, Inc. | 1.69 | 16.98 | 78.73 | 7.28 | 3.2206 | 0.0085 | |||
| EQR / Equity Residential | 1.16 | -5.76 | 78.03 | -11.14 | 3.1919 | -0.6517 | |||
| VICI / VICI Properties Inc. | 2.35 | -7.11 | 76.76 | -7.17 | 3.1400 | -0.4791 | |||
| LXP / LXP Industrial Trust | 9.18 | 44.42 | 75.81 | 37.91 | 3.1011 | 0.6950 | |||
| NTST / NETSTREIT Corp. | 3.84 | 13.79 | 64.95 | 21.55 | 2.6570 | 0.3179 | |||
| OUT / OUTFRONT Media Inc. | 3.93 | 23.97 | 64.06 | 25.35 | 2.6206 | 0.3836 | |||
| AVB / AvalonBay Communities, Inc. | 0.31 | 0.78 | 63.23 | -4.44 | 2.5867 | -0.3098 | |||
| AMH / American Homes 4 Rent | 1.64 | -1.03 | 59.18 | -5.59 | 2.4208 | -0.3228 | |||
| UDR / UDR, Inc. | 1.15 | -8.70 | 46.87 | -17.47 | 1.9174 | -0.5685 | |||
| NHI / National Health Investors, Inc. | 0.55 | -5.28 | 38.74 | -10.07 | 1.5846 | -0.3009 | |||
| CUBE / CubeSmart | 0.74 | -8.63 | 31.54 | -9.08 | 1.2901 | -0.2282 | |||
| FR / First Industrial Realty Trust, Inc. | 0.65 | 1.98 | 31.35 | -9.04 | 1.2825 | -0.2262 | |||
| EXR / Extra Space Storage Inc. | 0.20 | -0.01 | 29.46 | -0.72 | 1.2050 | -0.0937 | |||
| HST / Host Hotels & Resorts, Inc. | 1.87 | 22.70 | 28.79 | 32.63 | 1.1776 | 0.2276 | |||
| FRT / Federal Realty Investment Trust | 0.30 | 1,816.66 | 28.15 | 1,762.04 | 1.1517 | 1.0855 | |||
| CURB / Curbline Properties Corp. | 1.16 | 92.51 | 26.49 | 81.68 | 1.0835 | 0.4454 | |||
| BXP / Boston Properties, Inc. | 0.35 | 1.93 | 23.36 | 2.36 | 0.9557 | -0.0434 | |||
| KRG / Kite Realty Group Trust | 1.02 | -24.49 | 23.00 | -23.54 | 0.9407 | -0.3758 | |||
| CDP / COPT Defense Properties | 0.70 | 16.52 | 19.42 | 17.85 | 0.7943 | 0.0731 | |||
| ADC / Agree Realty Corporation | 0.21 | -1.11 | 15.05 | -6.40 | 0.6155 | -0.0881 | |||
| INVH / Invitation Homes Inc. | 0.41 | 0.00 | 13.56 | -5.88 | 0.5547 | -0.0759 | |||
| DRH / DiamondRock Hospitality Company | 1.30 | 17.52 | 9.95 | 16.61 | 0.4071 | 0.0335 | |||
| DOC / Healthpeak Properties, Inc. | 0.47 | 2.74 | 8.30 | -11.03 | 0.3396 | -0.0688 | |||
| VTR / Ventas, Inc. | 0.13 | -68.93 | 7.94 | -71.47 | 0.3248 | -0.8931 | |||
| ESS / Essex Property Trust, Inc. | 0.02 | -31.41 | 6.69 | -36.60 | 0.2737 | -0.1882 | |||
| KIM / Kimco Realty Corporation | 0.26 | -83.82 | 5.50 | -83.99 | 0.2249 | -1.2783 | |||
| SBAC / SBA Communications Corporation | 0.01 | -24.27 | 2.64 | -19.18 | 0.1079 | -0.0349 | |||
| REG / Regency Centers Corporation | 0.03 | 0.00 | 2.02 | -3.44 | 0.0828 | -0.0089 | |||
| KRC / Kilroy Realty Corporation | 0.04 | 0.00 | 1.21 | 4.76 | 0.0495 | -0.0011 | |||
| WY / Weyerhaeuser Company | 0.03 | -0.38 | 0.81 | -12.62 | 0.0332 | -0.0074 | |||
| CCI / Crown Castle Inc. | 0.01 | 120.88 | 0.51 | 117.37 | 0.0210 | 0.0107 | |||
| LAMR / Lamar Advertising Company | 0.00 | 10.36 | 0.41 | 17.61 | 0.0170 | 0.0015 | |||
| HIW / Highwoods Properties, Inc. | 0.00 | -100.00 | 0.00 | 0.0000 | |||||
| IRM / Iron Mountain Incorporated | 0.00 | -100.00 | 0.00 | 0.0000 | |||||
| HR / Healthcare Realty Trust Incorporated | 0.00 | -100.00 | 0.00 | 0.0000 |