Basic Stats
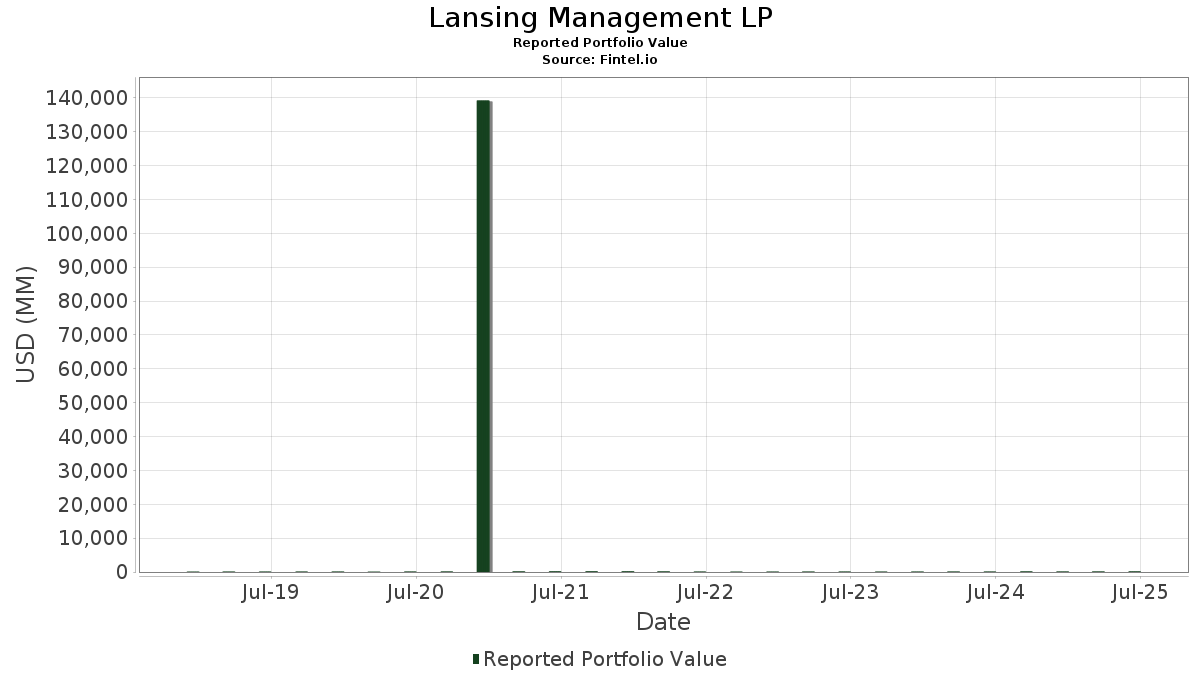
| Portfolio Value | $ 145,945,692 |
| Current Positions | 8 |
Latest Holdings, Performance, AUM (from 13F, 13D)
Lansing Management LP has disclosed 8 total holdings in their latest SEC filings. Most recent portfolio value is calculated to be $ 145,945,692 USD. Actual Assets Under Management (AUM) is this value plus cash (which is not disclosed). Lansing Management LP’s top holdings are Ferrari N.V. (US:RACE) , APi Group Corporation (US:APG) , Interactive Brokers Group, Inc. (US:IBKR) , Heico Corp. - Class A (US:HEIA) , and TransUnion (US:TRU) .
Top Increases This Quarter
We use the change in the portfolio allocation because this is the most meaningful metric. Changes can be due to trades or changes in share prices.
| Security | Shares (MM) |
Value (MM$) |
Portfolio % | ΔPortfolio % |
|---|---|---|---|---|
| 0.02 | 9.10 | 6.2327 | 2.0896 | |
| 0.45 | 23.12 | 15.8418 | 1.9937 | |
| 0.40 | 22.15 | 15.1764 | 1.2877 |
Top Decreases This Quarter
We use the change in the portfolio allocation because this is the most meaningful metric. Changes can be due to trades or changes in share prices.
| Security | Shares (MM) |
Value (MM$) |
Portfolio % | ΔPortfolio % |
|---|---|---|---|---|
| 0.03 | 16.96 | 11.6179 | -3.1840 | |
| 0.06 | 30.45 | 20.8635 | -1.4191 | |
| 0.20 | 17.56 | 12.0333 | -0.4360 | |
| 0.08 | 21.36 | 14.6363 | -0.2913 | |
| 0.03 | 5.25 | 3.5979 | -0.0408 |
13F and Fund Filings
This form was filed on 2025-08-14 for the reporting period 2025-06-30. Click the link icon to see the full transaction history.
Upgrade to unlock premium data and export to Excel ![]() .
.
| Security | Type | Avg Share Price | Shares (MM) |
ΔShares (%) |
ΔShares (%) |
Value ($MM) |
Portfolio (%) |
ΔPortfolio (%) |
|
|---|---|---|---|---|---|---|---|---|---|
| RACE / Ferrari N.V. | 0.06 | 0.00 | 30.45 | 14.69 | 20.8635 | -1.4191 | |||
| APG / APi Group Corporation | 0.45 | -1.84 | 23.12 | 40.13 | 15.8418 | 1.9937 | |||
| IBKR / Interactive Brokers Group, Inc. | 0.40 | 300.00 | 22.15 | 33.85 | 15.1764 | 1.2877 | |||
| HEIA / Heico Corp. - Class A | 0.08 | -2.08 | 21.36 | 20.11 | 14.6363 | -0.2913 | |||
| TRU / TransUnion | 0.20 | 11.48 | 17.56 | 18.21 | 12.0333 | -0.4360 | |||
| ROP / Roper Technologies, Inc. | 0.03 | 0.00 | 16.96 | -3.86 | 11.6179 | -3.1840 | |||
| MCO / Moody's Corporation | 0.02 | 71.08 | 9.10 | 84.28 | 6.2327 | 2.0896 | |||
| ZTS / Zoetis Inc. | 0.03 | 27.88 | 5.25 | 21.11 | 3.5979 | -0.0408 |