Basic Stats
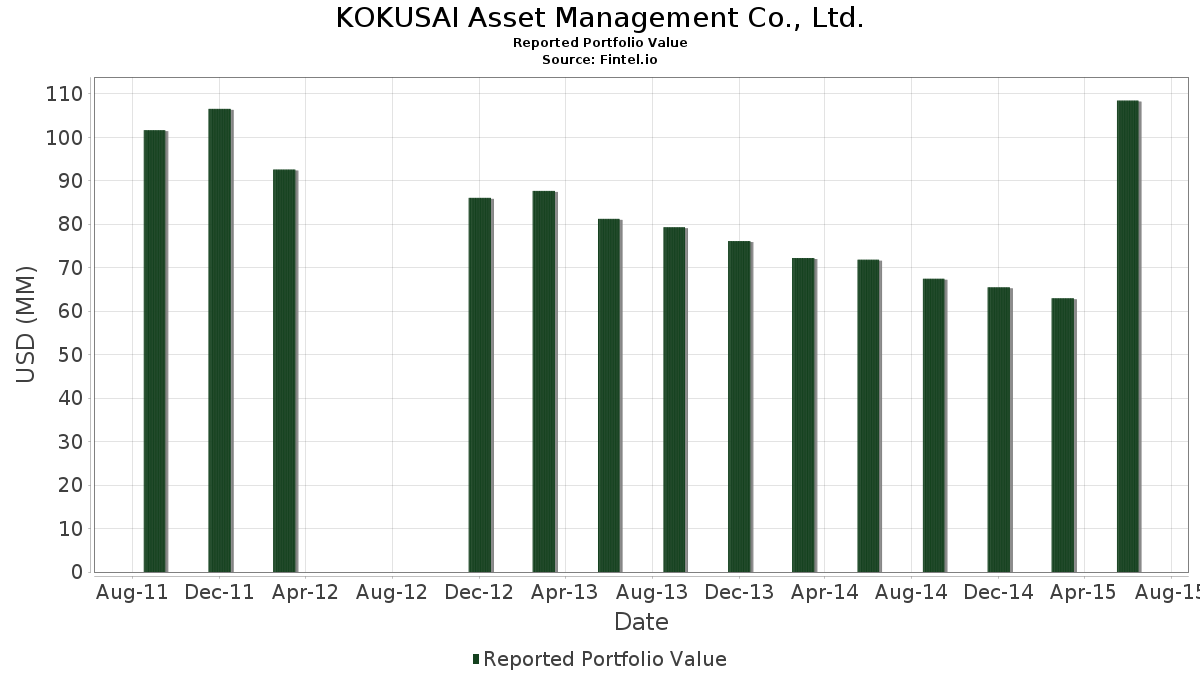
| Portfolio Value | $ 108,441,000 |
| Current Positions | 38 |
Latest Holdings, Performance, AUM (from 13F, 13D)
KOKUSAI Asset Management Co., Ltd. has disclosed 38 total holdings in their latest SEC filings. Most recent portfolio value is calculated to be $ 108,441,000 USD. Actual Assets Under Management (AUM) is this value plus cash (which is not disclosed). KOKUSAI Asset Management Co., Ltd.’s top holdings are iShares Trust - iShares J.P. Morgan USD Emerging Markets Bond ETF (US:EMB) , iShares, Inc. - iShares MSCI Emerging Markets Min Vol Factor ETF (US:EEMV) , Apple Inc. (US:AAPL) , AbbVie Inc. (US:ABBV) , and General Electric Company (US:GE) .
Top Increases This Quarter
We use the change in the portfolio allocation because this is the most meaningful metric. Changes can be due to trades or changes in share prices.
| Security | Shares (MM) |
Value (MM$) |
Portfolio % | ΔPortfolio % |
|---|---|---|---|---|
| 0.25 | 27.72 | 25.5641 | 9.5560 | |
| 0.40 | 23.29 | 21.4725 | 3.2693 | |
| 0.16 | 2.73 | 2.5193 | 1.2061 | |
| 0.01 | 0.22 | 0.2056 | 0.0750 | |
| 0.00 | 0.16 | 0.1448 | 0.0267 | |
| 0.00 | 0.32 | 0.2951 | 0.0266 |
Top Decreases This Quarter
We use the change in the portfolio allocation because this is the most meaningful metric. Changes can be due to trades or changes in share prices.
| Security | Shares (MM) |
Value (MM$) |
Portfolio % | ΔPortfolio % |
|---|---|---|---|---|
| 0.00 | 0.00 | -2.4605 | ||
| 0.03 | 3.95 | 3.6435 | -1.7131 | |
| 0.00 | 0.00 | -1.4366 | ||
| 0.06 | 3.24 | 2.9896 | -0.6525 | |
| 0.03 | 2.27 | 2.0896 | -0.5861 | |
| 0.05 | 2.67 | 2.4668 | -0.5798 | |
| 0.02 | 1.60 | 1.4764 | -0.5745 | |
| 0.01 | 1.81 | 1.6682 | -0.5175 | |
| 0.02 | 2.09 | 1.9236 | -0.4835 | |
| 0.02 | 1.31 | 1.2117 | -0.4599 |
13F and Fund Filings
This form was filed on 2015-07-24 for the reporting period 2015-06-30. Click the link icon to see the full transaction history.
Upgrade to unlock premium data and export to Excel ![]() .
.
| Security | Type | Avg Share Price | Shares (MM) |
ΔShares (%) |
ΔShares (%) |
Value ($MM) |
Portfolio (%) |
ΔPortfolio (%) |
|
|---|---|---|---|---|---|---|---|---|---|
| EMB / iShares Trust - iShares J.P. Morgan USD Emerging Markets Bond ETF | 0.25 | -2.87 | 27.72 | 80.93 | 25.5641 | 9.5560 | |||
| EEMV / iShares, Inc. - iShares MSCI Emerging Markets Min Vol Factor ETF | 0.40 | 159.78 | 23.29 | 33.65 | 21.4725 | 3.2693 | |||
| AAPL / Apple Inc. | 0.03 | -23.54 | 3.95 | -22.94 | 3.6435 | -1.7131 | |||
| ABBV / AbbVie Inc. | 0.05 | -6.25 | 3.43 | 7.60 | 3.1602 | -0.1674 | |||
| GE / General Electric Company | 0.13 | -5.86 | 3.42 | 0.83 | 3.1510 | -0.3897 | |||
| MRK / Merck & Co., Inc. | 0.06 | -6.10 | 3.24 | -7.00 | 2.9896 | -0.6525 | |||
| MSFT / Microsoft Corporation | 0.07 | -6.17 | 2.89 | 1.90 | 2.6641 | -0.2978 | |||
| BAC / Bank of America Corporation | 0.16 | 96.45 | 2.73 | 117.34 | 2.5193 | 1.2061 | |||
| MO / Altria Group, Inc. | 0.05 | -6.17 | 2.67 | -8.26 | 2.4668 | -0.5798 | |||
| TWC / Spectrum Management Holding Company LLC | 0.01 | -5.52 | 2.44 | 12.33 | 2.2510 | -0.0193 | |||
| ACN / Accenture plc | 0.02 | -6.39 | 2.41 | -3.29 | 2.2224 | -0.3812 | |||
| T / AT&T Inc. | 0.07 | -6.18 | 2.37 | 2.06 | 2.1883 | -0.2408 | |||
| CL / Colgate-Palmolive Company | 0.03 | -6.23 | 2.27 | -11.52 | 2.0896 | -0.5861 | |||
| JNJ / Johnson & Johnson | 0.02 | -6.55 | 2.09 | -9.46 | 1.9236 | -0.4835 | |||
| PEP / PepsiCo, Inc. | 0.02 | -6.06 | 2.02 | -8.33 | 1.8674 | -0.4405 | |||
| GD / General Dynamics Corporation | 0.01 | -6.80 | 1.94 | -2.71 | 1.7899 | -0.2944 | |||
| JPM / JPMorgan Chase & Co. | 0.03 | -5.95 | 1.93 | 5.18 | 1.7788 | -0.1373 | |||
| BA / The Boeing Company | 0.01 | -6.46 | 1.81 | -13.53 | 1.6682 | -0.5175 | |||
| OXY / Occidental Petroleum Corporation | 0.02 | -5.92 | 1.73 | 0.23 | 1.5963 | -0.2081 | |||
| CVX / Chevron Corporation | 0.02 | -11.23 | 1.60 | -18.44 | 1.4764 | -0.5745 | |||
| COP / ConocoPhillips | 0.02 | -6.30 | 1.46 | -7.53 | 1.3482 | -0.3036 | |||
| LYB / LyondellBasell Industries N.V. | 0.01 | -6.16 | 1.42 | 10.61 | 1.3076 | -0.0318 | |||
| CCL / Carnival Corporation & plc | 0.03 | -6.51 | 1.35 | -3.51 | 1.2431 | -0.2165 | |||
| NSC / Norfolk Southern Corporation | 0.02 | -3.22 | 1.31 | -17.87 | 1.2117 | -0.4599 | |||
| AMP / Ameriprise Financial, Inc. | 0.01 | -5.89 | 1.20 | -10.14 | 1.1038 | -0.2878 | |||
| RTX / RTX Corporation | 0.01 | -7.83 | 1.18 | -12.76 | 1.0845 | -0.3239 | |||
| FE / FirstEnergy Corp. | 0.04 | -6.32 | 1.16 | -12.99 | 1.0688 | -0.3229 | |||
| MDU / MDU Resources Group, Inc. | 0.06 | -6.06 | 1.15 | -14.05 | 1.0605 | -0.3374 | |||
| HRL / Hormel Foods Corporation | 0.02 | -6.18 | 0.94 | -7.02 | 0.8678 | -0.1896 | |||
| WAB / Westinghouse Air Brake Technologies Corporation | 0.00 | 25.93 | 0.32 | 24.51 | 0.2951 | 0.0266 | |||
| UNP / Union Pacific Corporation | 0.00 | 17.39 | 0.26 | 3.21 | 0.2370 | -0.0232 | |||
| GBX / The Greenbrier Companies, Inc. | 0.01 | 28.21 | 0.23 | 3.54 | 0.2158 | -0.0203 | |||
| HOLI / Hollysys Automation Technologies Ltd. | 0.01 | 47.62 | 0.22 | 78.40 | 0.2056 | 0.0750 | |||
| CSX / CSX Corporation | 0.00 | 41.18 | 0.16 | 38.94 | 0.1448 | 0.0267 | |||
| GWR / Genesee & Wyoming, Inc. | 0.00 | -14.29 | 0.05 | -32.35 | 0.0424 | -0.0286 | |||
| ARII / American Railcar Industries, Inc. | 0.00 | 0.00 | 0.04 | -2.50 | 0.0360 | -0.0058 | |||
| GATX / GATX Corporation | 0.00 | -16.67 | 0.03 | -22.86 | 0.0249 | -0.0117 | |||
| TRN / Trinity Industries, Inc. | 0.00 | 0.00 | 0.02 | -25.00 | 0.0194 | -0.0099 | |||
| WWD / Woodward, Inc. | 0.00 | 0.00 | 0.0000 | 0.0000 | |||||
| TXN / Texas Instruments Incorporated | 0.00 | 0.00 | 0.0000 | 0.0000 | |||||
| PG / The Procter & Gamble Company | 0.00 | 0.00 | 0.0000 | 0.0000 | |||||
| GLD / SPDR Gold Trust | 0.00 | 0.00 | 0.0000 | ||||||
| TKR / The Timken Company | 0.00 | 0.00 | 0.0000 | 0.0000 | |||||
| INFY / Infosys Limited - Depositary Receipt (Common Stock) | 0.00 | 0.00 | 0.0000 | ||||||
| PBI / Pitney Bowes Inc. | 0.00 | 0.00 | 0.0000 | ||||||
| INTC / Intel Corporation | 0.00 | 0.00 | 0.0000 | 0.0000 | |||||
| SLV / iShares Silver Trust | 0.00 | 0.00 | 0.0000 | ||||||
| BK / The Bank of New York Mellon Corporation | 0.00 | 0.00 | 0.0000 | 0.0000 | |||||
| US92833U2024 / VisionChina Media, Inc. | 0.00 | 0.00 | 0.0000 | 0.0000 | |||||
| US2243991054 / Crane Co. | 0.00 | 0.00 | 0.0000 | 0.0000 | |||||
| MET / MetLife, Inc. | 0.00 | 0.00 | 0.0000 | 0.0000 | |||||
| WHR / Whirlpool Corporation | 0.00 | 0.00 | 0.0000 | 0.0000 | |||||
| RSG / Republic Services, Inc. | 0.00 | 0.00 | 0.0000 | 0.0000 | |||||
| AEP / American Electric Power Company, Inc. | 0.00 | -100.00 | 0.00 | -100.00 | -2.4605 | ||||
| GOOGL / Alphabet Inc. | 0.00 | 0.00 | 0.0000 | 0.0000 | |||||
| BKU / BankUnited, Inc. | 0.00 | 0.00 | 0.0000 | 0.0000 | |||||
| LOW / Lowe's Companies, Inc. | 0.00 | 0.00 | 0.0000 | 0.0000 | |||||
| CMCSA / Comcast Corporation | 0.00 | 0.00 | 0.0000 | 0.0000 | |||||
| KSU / Kansas City Southern | 0.00 | 0.00 | 0.0000 | 0.0000 | |||||
| FSTR / L.B. Foster Company | 0.00 | 0.00 | 0.0000 | 0.0000 | |||||
| XLNX / Xilinx, Inc. | 0.00 | 0.00 | 0.0000 | 0.0000 | |||||
| RAIL / FreightCar America, Inc. | 0.00 | -100.00 | 0.00 | -100.00 | -0.0063 | ||||
| PRU / Prudential Financial, Inc. | 0.00 | 0.00 | 0.0000 | 0.0000 | |||||
| CAT / Caterpillar Inc. | 0.00 | 0.00 | 0.0000 | 0.0000 | |||||
| CB / Chubb Limited | 0.00 | 0.00 | 0.0000 | 0.0000 | |||||
| MTB / M&T Bank Corporation | 0.00 | 0.00 | 0.0000 | 0.0000 | |||||
| PFG / Principal Financial Group, Inc. | 0.00 | 0.00 | 0.0000 | 0.0000 | |||||
| COF / Capital One Financial Corporation | 0.00 | 0.00 | 0.0000 | 0.0000 | |||||
| AIG / American International Group, Inc. | 0.00 | -100.00 | 0.00 | -100.00 | -1.4366 | ||||
| ABT / Abbott Laboratories | 0.00 | 0.00 | 0.0000 | 0.0000 |