Basic Stats
| Portfolio Value | $ 332,587,967 |
| Current Positions | 74 |
Latest Holdings, Performance, AUM (from 13F, 13D)
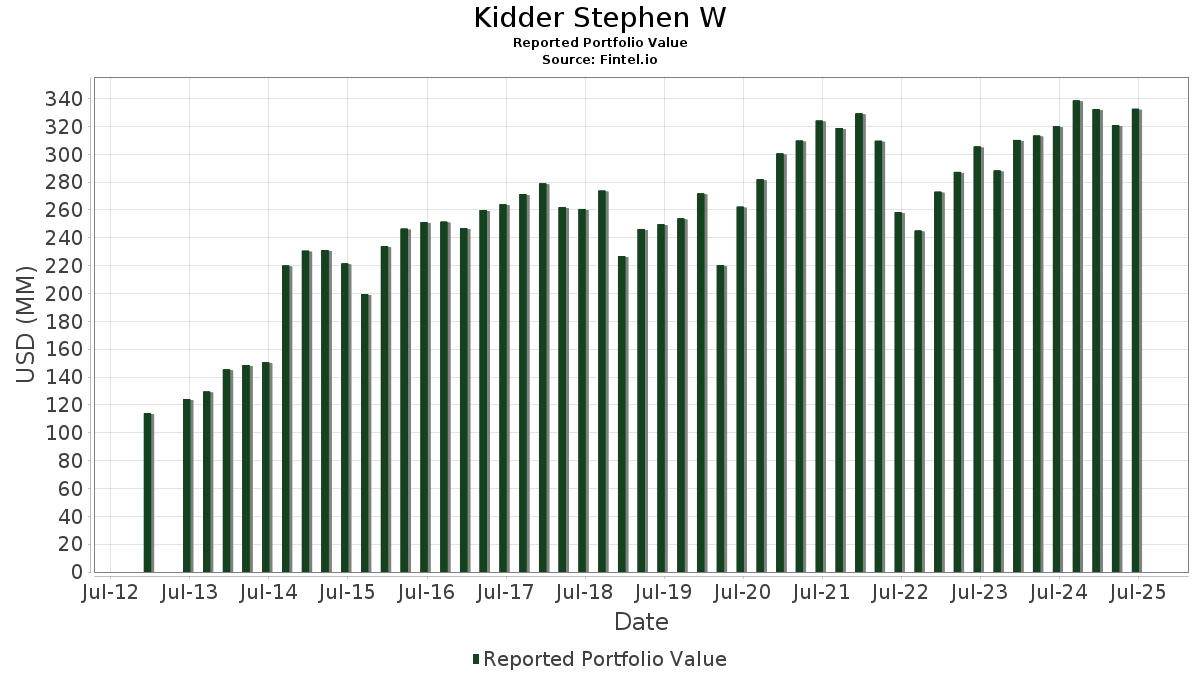
Kidder Stephen W has disclosed 74 total holdings in their latest SEC filings. Most recent portfolio value is calculated to be $ 332,587,967 USD. Actual Assets Under Management (AUM) is this value plus cash (which is not disclosed). Kidder Stephen W’s top holdings are Apple Inc. (US:AAPL) , Microsoft Corporation (US:MSFT) , Automatic Data Processing, Inc. (US:ADP) , Alphabet Inc. (US:GOOGL) , and Direxion Shares ETF Trust - Direxion Daily NVDA Bear 1X Shares (US:NVDD) . Kidder Stephen W’s new positions include The Charles Schwab Corporation (US:SCHW) , American Express Company (US:AXP) , Applied Materials, Inc. (US:AMAT) , GE Vernova Inc. (US:GEV) , and .
Top Increases This Quarter
We use the change in the portfolio allocation because this is the most meaningful metric. Changes can be due to trades or changes in share prices.
| Security | Shares (MM) |
Value (MM$) |
Portfolio % | ΔPortfolio % |
|---|---|---|---|---|
| 0.03 | 17.18 | 5.1648 | 1.0689 | |
| 0.07 | 9.36 | 2.8135 | 0.6910 | |
| 0.06 | 13.85 | 4.1656 | 0.4376 | |
| 0.05 | 11.64 | 3.4997 | 0.3905 | |
| 0.02 | 1.99 | 0.5995 | 0.3637 | |
| 0.00 | 2.44 | 0.7336 | 0.3152 | |
| 0.01 | 1.01 | 0.3025 | 0.3025 | |
| 0.00 | 0.98 | 0.2949 | 0.2949 | |
| 0.03 | 2.02 | 0.6081 | 0.2364 | |
| 0.00 | 0.74 | 0.2229 | 0.2229 |
Top Decreases This Quarter
We use the change in the portfolio allocation because this is the most meaningful metric. Changes can be due to trades or changes in share prices.
| Security | Shares (MM) |
Value (MM$) |
Portfolio % | ΔPortfolio % |
|---|---|---|---|---|
| 0.14 | 28.53 | 1.7898 | -7.7881 | |
| 0.07 | 12.27 | 0.7695 | -4.1494 | |
| 0.05 | 15.95 | 1.0005 | -4.1392 | |
| 0.09 | 15.63 | 0.9805 | -3.3397 | |
| 0.07 | 10.41 | 0.6533 | -2.9886 | |
| 0.06 | 9.46 | 0.5934 | -2.6028 | |
| 0.03 | 10.12 | 0.6345 | -2.4760 | |
| 0.06 | 9.87 | 0.6192 | -2.3249 | |
| 0.09 | 14.86 | 0.9323 | -2.3224 | |
| 0.07 | 8.99 | 0.5638 | -2.2932 |
13F and Fund Filings
This form was filed on 2025-07-23 for the reporting period 2025-06-30. Click the link icon to see the full transaction history.
Upgrade to unlock premium data and export to Excel ![]() .
.
| Security | Type | Avg Share Price | Shares (MM) |
ΔShares (%) |
ΔShares (%) |
Value ($MM) |
Portfolio (%) |
ΔPortfolio (%) |
|
|---|---|---|---|---|---|---|---|---|---|
| AAPL / Apple Inc. | 0.14 | 0.54 | 28.53 | -7.13 | 1.7898 | -7.7881 | |||
| MSFT / Microsoft Corporation | 0.03 | -1.33 | 17.18 | 30.74 | 5.1648 | 1.0689 | |||
| ADP / Automatic Data Processing, Inc. | 0.05 | -4.16 | 15.95 | -3.26 | 1.0005 | -4.1392 | |||
| GOOGL / Alphabet Inc. | 0.09 | -1.03 | 15.63 | 12.79 | 0.9805 | -3.3397 | |||
| NVDD / Direxion Shares ETF Trust - Direxion Daily NVDA Bear 1X Shares | 0.09 | -2.35 | 14.86 | 42.36 | 0.9323 | -2.3224 | |||
| MA / Mastercard Incorporated | 0.03 | -6.76 | 14.38 | -4.41 | 4.3240 | -0.3661 | |||
| AMZN / Amazon.com, Inc. | 0.06 | 0.47 | 13.85 | 15.86 | 4.1656 | 0.4376 | |||
| ABT / Abbott Laboratories | 0.09 | -1.92 | 12.36 | 0.57 | 3.7170 | -0.1153 | |||
| FI / Fiserv, Inc. | 0.07 | -0.42 | 12.27 | -22.25 | 0.7695 | -4.1494 | |||
| ADI / Analog Devices, Inc. | 0.05 | -1.12 | 11.64 | 16.71 | 3.4997 | 0.3905 | |||
| RTX / RTX Corporation | 0.08 | -4.68 | 11.39 | 5.08 | 3.4234 | 0.0455 | |||
| JNJ / Johnson & Johnson | 0.07 | -3.21 | 10.41 | -10.85 | 0.6533 | -2.9886 | |||
| HD / The Home Depot, Inc. | 0.03 | 1.34 | 10.12 | 1.37 | 0.6345 | -2.4760 | |||
| ATR / AptarGroup, Inc. | 0.06 | -0.86 | 9.87 | 4.51 | 0.6192 | -2.3249 | |||
| PG / The Procter & Gamble Company | 0.06 | -1.30 | 9.46 | -7.74 | 0.5934 | -2.6028 | |||
| AMD / Advanced Micro Devices, Inc. | 0.07 | -0.49 | 9.36 | 37.44 | 2.8135 | 0.6910 | |||
| TJX / The TJX Companies, Inc. | 0.07 | -3.27 | 8.99 | -1.92 | 0.5638 | -2.2932 | |||
| ROK / Rockwell Automation, Inc. | 0.03 | -14.21 | 8.37 | 10.29 | 0.5250 | -1.8408 | |||
| SBGSY / Schneider Electric S.E. - Depositary Receipt (Common Stock) | 0.14 | 0.54 | 7.46 | 16.87 | 0.4681 | -1.5222 | |||
| DHR / Danaher Corporation | 0.04 | -0.31 | 7.20 | -3.93 | 0.4519 | -1.8860 | |||
| CARR / Carrier Global Corporation | 0.09 | 0.28 | 6.72 | 15.77 | 2.0201 | 0.2109 | |||
| XYL / Xylem Inc. | 0.05 | -0.32 | 6.33 | 7.93 | 1.9025 | 0.0751 | |||
| CNI / Canadian National Railway Company | 0.06 | -7.62 | 5.87 | -1.39 | 0.3685 | -1.4883 | |||
| VRTX / Vertex Pharmaceuticals Incorporated | 0.01 | 1.37 | 5.40 | -6.91 | 0.3388 | -1.4698 | |||
| CVX / Chevron Corporation | 0.03 | 0.68 | 4.85 | -13.83 | 1.4594 | -0.2964 | |||
| UNH / UnitedHealth Group Incorporated | 0.01 | 1.50 | 4.67 | -39.55 | 0.2929 | -2.1150 | |||
| MKC.V / McCormick & Company, Incorporated | 0.05 | -0.77 | 4.11 | -8.59 | 0.2575 | -1.1427 | |||
| DE / Deere & Company | 0.01 | -2.09 | 3.34 | 6.10 | 1.0037 | 0.0227 | |||
| JPM / JPMorgan Chase & Co. | 0.01 | -2.72 | 2.97 | 14.97 | 0.8937 | 0.0877 | |||
| LLY / Eli Lilly and Company | 0.00 | 92.62 | 2.44 | 81.74 | 0.7336 | 0.3152 | |||
| CRM / Salesforce, Inc. | 0.01 | 16.15 | 2.42 | 18.05 | 0.7277 | 0.0884 | |||
| ABBV / AbbVie Inc. | 0.01 | -1.44 | 2.35 | -12.68 | 0.7063 | -0.1324 | |||
| XOM / Exxon Mobil Corporation | 0.02 | -1.84 | 2.30 | -11.04 | 0.1446 | -0.6630 | |||
| NVO / Novo Nordisk A/S - Depositary Receipt (Common Stock) | 0.03 | 70.63 | 2.02 | 69.63 | 0.6081 | 0.2364 | |||
| UBER / Uber Technologies, Inc. | 0.02 | 105.88 | 1.99 | 163.62 | 0.5995 | 0.3637 | |||
| BRK.B / Berkshire Hathaway Inc. | 0.00 | -5.46 | 1.90 | -13.74 | 0.1193 | -0.5684 | |||
| PEP / PepsiCo, Inc. | 0.01 | -12.63 | 1.80 | -23.05 | 0.5410 | -0.1881 | |||
| BAC / Bank of America Corporation | 0.03 | -0.25 | 1.43 | 13.09 | 0.4313 | 0.0360 | |||
| WMT / Walmart Inc. | 0.01 | -2.25 | 1.27 | 8.90 | 0.3826 | 0.0182 | |||
| NSRGY / Nestlé S.A. - Depositary Receipt (Common Stock) | 0.01 | -42.46 | 1.25 | -43.55 | 0.0785 | -0.6124 | |||
| BA / The Boeing Company | 0.01 | 0.00 | 1.22 | 22.86 | 0.3670 | 0.0573 | |||
| SCHW / The Charles Schwab Corporation | 0.01 | 1.01 | 0.3025 | 0.3025 | |||||
| AXP / American Express Company | 0.00 | 0.98 | 0.2949 | 0.2949 | |||||
| UNP / Union Pacific Corporation | 0.00 | -0.27 | 0.94 | -2.88 | 0.2839 | -0.0191 | |||
| SPY / SPDR S&P 500 ETF | 0.00 | -1.61 | 0.94 | 8.65 | 0.2833 | 0.0130 | |||
| MMM / 3M Company | 0.01 | 3.59 | 0.93 | 7.39 | 0.2798 | 0.0097 | |||
| AMAT / Applied Materials, Inc. | 0.00 | 0.74 | 0.2229 | 0.2229 | |||||
| SYK / Stryker Corporation | 0.00 | 0.87 | 0.74 | 7.29 | 0.2214 | 0.0073 | |||
| BR / Broadridge Financial Solutions, Inc. | 0.00 | 0.00 | 0.72 | 0.14 | 0.0450 | -0.1780 | |||
| GABELLI UTILITES FUND CLASS A / Equity Mutual Fu (36240E202) | 0.14 | 0.71 | 0.0000 | ||||||
| MRK / Merck & Co., Inc. | 0.01 | 0.29 | 0.69 | -11.59 | 0.2090 | -0.0360 | |||
| GSCE / GS Connect S&P GSCI Enhanced Commodity Total Return ETN | 0.00 | -5.15 | 0.65 | 23.06 | 0.0408 | -0.1243 | |||
| GOOG / Alphabet Inc. | 0.00 | 1.71 | 0.61 | 15.44 | 0.0385 | -0.1271 | |||
| KO / The Coca-Cola Company | 0.01 | -0.60 | 0.59 | -1.84 | 0.0368 | -0.1496 | |||
| COST / Costco Wholesale Corporation | 0.00 | 0.55 | 0.54 | 5.25 | 0.1628 | 0.0024 | |||
| INTC / Intel Corporation | 0.02 | 6.64 | 0.47 | 5.13 | 0.0296 | -0.1102 | |||
| D / Dominion Energy, Inc. | 0.01 | 0.00 | 0.46 | 0.88 | 0.1386 | -0.0040 | |||
| IVV / iShares Trust - iShares Core S&P 500 ETF | 0.00 | -6.67 | 0.43 | 3.09 | 0.0273 | -0.1041 | |||
| V / Visa Inc. | 0.00 | 4.89 | 0.39 | 6.30 | 0.1167 | 0.0028 | |||
| GE / General Electric Company | 0.00 | 0.00 | 0.34 | 28.52 | 0.1018 | 0.0197 | |||
| APD / Air Products and Chemicals, Inc. | 0.00 | 0.00 | 0.31 | -4.32 | 0.0195 | -0.0817 | |||
| VZ / Verizon Communications Inc. | 0.01 | 4.22 | 0.30 | -0.66 | 0.0906 | -0.0039 | |||
| STT / State Street Corporation | 0.00 | -2.59 | 0.30 | 15.83 | 0.0188 | -0.0621 | |||
| PAYX / Paychex, Inc. | 0.00 | -6.21 | 0.30 | -11.64 | 0.0186 | -0.0860 | |||
| GEV / GE Vernova Inc. | 0.00 | 0.29 | 0.0877 | 0.0877 | |||||
| NVZMF / Novozymes A/S | 0.00 | 14.18 | 0.29 | 41.18 | 0.0181 | -0.0456 | |||
| BALL / Ball Corporation | 0.01 | -67.05 | 0.28 | -64.53 | 0.0177 | -0.2303 | |||
| CB / Chubb Limited | 0.00 | 7.23 | 0.26 | 2.80 | 0.0162 | -0.0620 | |||
| NEE / NextEra Energy, Inc. | 0.00 | 26.09 | 0.25 | 23.65 | 0.0757 | 0.0121 | |||
| EMR / Emerson Electric Co. | 0.00 | 0.25 | 0.0742 | 0.0742 | |||||
| RMD / ResMed Inc. | 0.00 | 0.24 | 0.0153 | 0.0153 | |||||
| US9229087104 / VANGUARD 500 INDEX FUND VANGUARD 500 INDEX ADM | 0.00 | 0.00 | 0.23 | 10.63 | 0.0144 | -0.0502 | |||
| BMY / Bristol-Myers Squibb Company | 0.00 | 3.26 | 0.22 | -21.79 | 0.0661 | -0.0213 | |||
| FIS / Fidelity National Information Services, Inc. | 0.00 | 0.00 | 0.22 | 8.96 | 0.0138 | -0.0491 | |||
| AON / Aon plc | 0.00 | -100.00 | 0.00 | 0.0000 | |||||
| GIS / General Mills, Inc. | 0.00 | -100.00 | 0.00 | 0.0000 |