Basic Stats
| Portfolio Value | $ 174,443,549 |
| Current Positions | 44 |
Latest Holdings, Performance, AUM (from 13F, 13D)
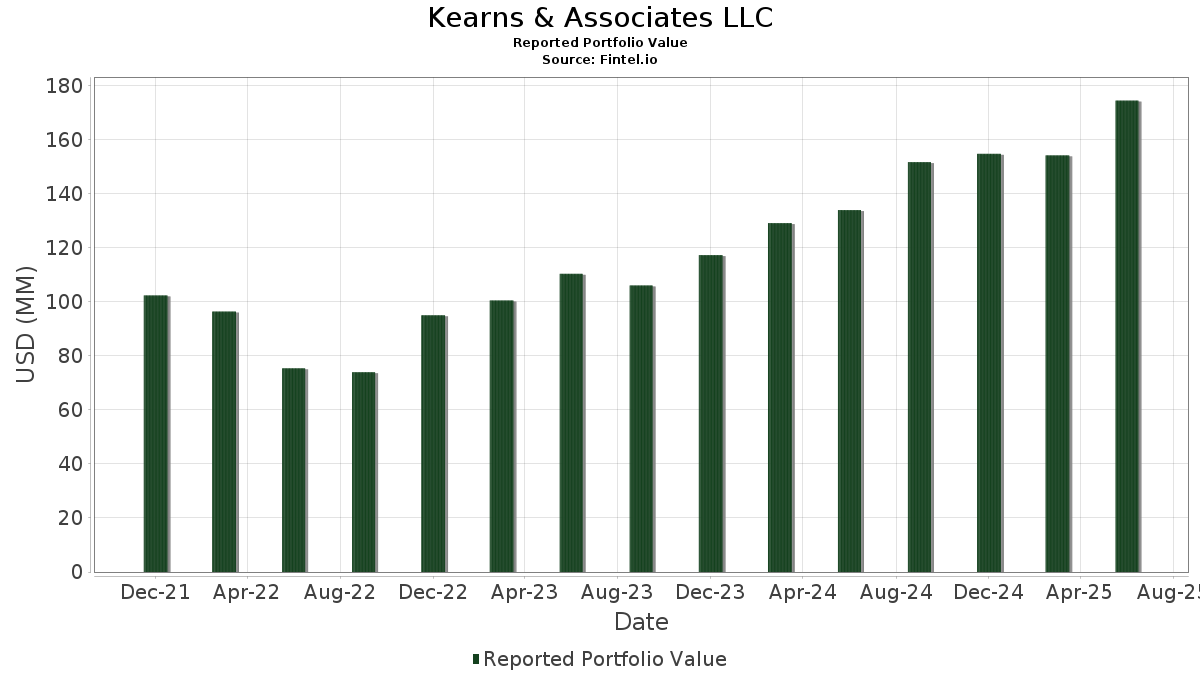
Kearns & Associates LLC has disclosed 44 total holdings in their latest SEC filings. Most recent portfolio value is calculated to be $ 174,443,549 USD. Actual Assets Under Management (AUM) is this value plus cash (which is not disclosed). Kearns & Associates LLC’s top holdings are Vanguard Index Funds - Vanguard Total Stock Market ETF (US:VTI) , Vanguard Index Funds - Vanguard S&P 500 ETF (US:VOO) , Vanguard Tax-Managed Funds - Vanguard FTSE Developed Markets ETF (US:VEA) , Vanguard Index Funds - Vanguard Small-Cap ETF (US:VB) , and SPDR S&P 500 ETF (US:SPY) . Kearns & Associates LLC’s new positions include Fidelity Merrimack Street Trust - Fidelity Total Bond ETF (US:FBND) , Morgan Stanley (US:MS) , SPDR Gold Trust (US:GLD) , .
Top Increases This Quarter
We use the change in the portfolio allocation because this is the most meaningful metric. Changes can be due to trades or changes in share prices.
| Security | Shares (MM) |
Value (MM$) |
Portfolio % | ΔPortfolio % |
|---|---|---|---|---|
| 0.17 | 52.84 | 30.2880 | 1.0933 | |
| 0.02 | 0.71 | 0.4069 | 0.4069 | |
| 0.31 | 17.66 | 10.1219 | 0.2934 | |
| 0.00 | 2.14 | 1.2261 | 0.1791 | |
| 0.00 | 0.21 | 0.1211 | 0.1211 | |
| 0.00 | 0.21 | 0.1197 | 0.1197 | |
| 0.00 | 1.73 | 0.9901 | 0.0593 | |
| 0.00 | 0.71 | 0.4057 | 0.0514 | |
| 0.01 | 0.92 | 0.5297 | 0.0460 | |
| 0.00 | 0.48 | 0.2725 | 0.0386 |
Top Decreases This Quarter
We use the change in the portfolio allocation because this is the most meaningful metric. Changes can be due to trades or changes in share prices.
| Security | Shares (MM) |
Value (MM$) |
Portfolio % | ΔPortfolio % |
|---|---|---|---|---|
| 0.09 | 51.95 | 29.7814 | -0.7061 | |
| 0.02 | 4.25 | 2.4379 | -0.5487 | |
| 0.04 | 9.23 | 5.2919 | -0.3041 | |
| 0.00 | 0.46 | 0.2633 | -0.1127 | |
| 0.00 | 0.63 | 0.3585 | -0.0942 | |
| 0.11 | 5.28 | 3.0253 | -0.0861 | |
| 0.01 | 5.94 | 3.4037 | -0.0832 | |
| 0.00 | 1.14 | 0.6513 | -0.0761 | |
| 0.01 | 0.48 | 0.2774 | -0.0684 | |
| 0.01 | 0.29 | 0.1648 | -0.0490 |
13F and Fund Filings
This form was filed on 2025-07-09 for the reporting period 2025-06-30. Click the link icon to see the full transaction history.
Upgrade to unlock premium data and export to Excel ![]() .
.
| Security | Type | Avg Share Price | Shares (MM) |
ΔShares (%) |
ΔShares (%) |
Value ($MM) |
Portfolio (%) |
ΔPortfolio (%) |
|
|---|---|---|---|---|---|---|---|---|---|
| VTI / Vanguard Index Funds - Vanguard Total Stock Market ETF | 0.17 | 6.15 | 52.84 | 17.39 | 30.2880 | 1.0933 | |||
| VOO / Vanguard Index Funds - Vanguard S&P 500 ETF | 0.09 | 0.00 | 51.95 | 10.53 | 29.7814 | -0.7061 | |||
| VEA / Vanguard Tax-Managed Funds - Vanguard FTSE Developed Markets ETF | 0.31 | 3.90 | 17.66 | 16.53 | 10.1219 | 0.2934 | |||
| VB / Vanguard Index Funds - Vanguard Small-Cap ETF | 0.04 | 0.13 | 9.23 | 7.00 | 5.2919 | -0.3041 | |||
| SPY / SPDR S&P 500 ETF | 0.01 | 0.00 | 5.94 | 10.46 | 3.4037 | -0.0832 | |||
| VWO / Vanguard International Equity Index Funds - Vanguard FTSE Emerging Markets ETF | 0.11 | 0.68 | 5.28 | 10.03 | 3.0253 | -0.0861 | |||
| AAPL / Apple Inc. | 0.02 | 0.00 | 4.25 | -7.65 | 2.4379 | -0.5487 | |||
| RPRX / Royalty Pharma plc | 0.07 | 0.00 | 2.55 | 15.71 | 1.4611 | 0.0327 | |||
| MSFT / Microsoft Corporation | 0.00 | 0.00 | 2.14 | 32.47 | 1.2261 | 0.1791 | |||
| SCHF / Schwab Strategic Trust - Schwab International Equity ETF | 0.08 | 2.91 | 1.86 | 15.00 | 1.0638 | 0.0169 | |||
| VUG / Vanguard Index Funds - Vanguard Growth ETF | 0.00 | 1.81 | 1.73 | 20.43 | 0.9901 | 0.0593 | |||
| V / Visa Inc. | 0.00 | 0.00 | 1.14 | 1.34 | 0.6513 | -0.0761 | |||
| PJUL / Innovator ETFs Trust - Innovator U.S. Equity Power Buffer ETF - July | 0.03 | 0.00 | 1.13 | 9.08 | 0.6474 | -0.0240 | |||
| AMZN / Amazon.com, Inc. | 0.00 | 0.00 | 1.02 | 15.35 | 0.5861 | 0.0110 | |||
| IGM / iShares Trust - iShares Expanded Tech Sector ETF | 0.01 | 0.00 | 0.92 | 24.03 | 0.5297 | 0.0460 | |||
| BAC / Bank of America Corporation | 0.02 | 0.00 | 0.92 | 13.41 | 0.5290 | 0.0011 | |||
| AXP / American Express Company | 0.00 | 0.00 | 0.89 | 18.59 | 0.5120 | 0.0233 | |||
| GOOG / Alphabet Inc. | 0.00 | 0.00 | 0.85 | 13.62 | 0.4881 | 0.0017 | |||
| GOOGL / Alphabet Inc. | 0.00 | 0.00 | 0.85 | 13.88 | 0.4849 | 0.0034 | |||
| SCHW / The Charles Schwab Corporation | 0.01 | 0.00 | 0.82 | 16.62 | 0.4707 | 0.0137 | |||
| SCHE / Schwab Strategic Trust - Schwab Emerging Markets Equity ETF | 0.03 | 0.00 | 0.76 | 9.35 | 0.4361 | -0.0153 | |||
| FBND / Fidelity Merrimack Street Trust - Fidelity Total Bond ETF | 0.02 | 0.71 | 0.4069 | 0.4069 | |||||
| GS / The Goldman Sachs Group, Inc. | 0.00 | 0.00 | 0.71 | 29.49 | 0.4057 | 0.0514 | |||
| IJR / iShares Trust - iShares Core S&P Small-Cap ETF | 0.01 | 0.00 | 0.63 | 4.45 | 0.3639 | -0.0301 | |||
| MMC / Marsh & McLennan Companies, Inc. | 0.00 | 0.00 | 0.63 | -10.33 | 0.3585 | -0.0942 | |||
| JPM / JPMorgan Chase & Co. | 0.00 | 0.00 | 0.57 | 18.33 | 0.3257 | 0.0139 | |||
| WFC / Wells Fargo & Company | 0.01 | 0.00 | 0.56 | 11.55 | 0.3215 | -0.0045 | |||
| HLF / Herbalife Ltd. | 0.06 | 0.00 | 0.49 | -0.20 | 0.2812 | -0.0373 | |||
| OXY / Occidental Petroleum Corporation | 0.01 | 6.65 | 0.48 | -9.38 | 0.2774 | -0.0684 | |||
| JCI / Johnson Controls International plc | 0.00 | 0.00 | 0.48 | 31.94 | 0.2725 | 0.0386 | |||
| COF / Capital One Financial Corporation | 0.00 | 0.00 | 0.46 | 18.51 | 0.2647 | 0.0123 | |||
| TMO / Thermo Fisher Scientific Inc. | 0.00 | -2.75 | 0.46 | -20.73 | 0.2633 | -0.1127 | |||
| VNQ / Vanguard Specialized Funds - Vanguard Real Estate ETF | 0.01 | -1.26 | 0.45 | -2.83 | 0.2559 | -0.0423 | |||
| SYK / Stryker Corporation | 0.00 | 0.00 | 0.38 | 6.16 | 0.2177 | -0.0141 | |||
| IVV / iShares Trust - iShares Core S&P 500 ETF | 0.00 | 0.00 | 0.38 | 10.62 | 0.2153 | -0.0052 | |||
| DIS / The Walt Disney Company | 0.00 | 0.00 | 0.37 | 25.50 | 0.2147 | 0.0213 | |||
| EQIX / Equinix, Inc. | 0.00 | 0.00 | 0.31 | -2.24 | 0.1756 | -0.0281 | |||
| QCOM / QUALCOMM Incorporated | 0.00 | 0.00 | 0.30 | 3.77 | 0.1739 | -0.0159 | |||
| BKR / Baker Hughes Company | 0.01 | 0.00 | 0.29 | -12.77 | 0.1648 | -0.0490 | |||
| COP / ConocoPhillips | 0.00 | 0.00 | 0.22 | -14.62 | 0.1277 | -0.0414 | |||
| LOW / Lowe's Companies, Inc. | 0.00 | 0.00 | 0.22 | -5.15 | 0.1272 | -0.0241 | |||
| MS / Morgan Stanley | 0.00 | 0.21 | 0.1211 | 0.1211 | |||||
| GLD / SPDR Gold Trust | 0.00 | 0.21 | 0.1197 | 0.1197 | |||||
| UNP / Union Pacific Corporation | 0.00 | 0.00 | 0.21 | -2.36 | 0.1187 | -0.0192 | |||
| PGR / The Progressive Corporation | 0.00 | -100.00 | 0.00 | 0.0000 |