Basic Stats
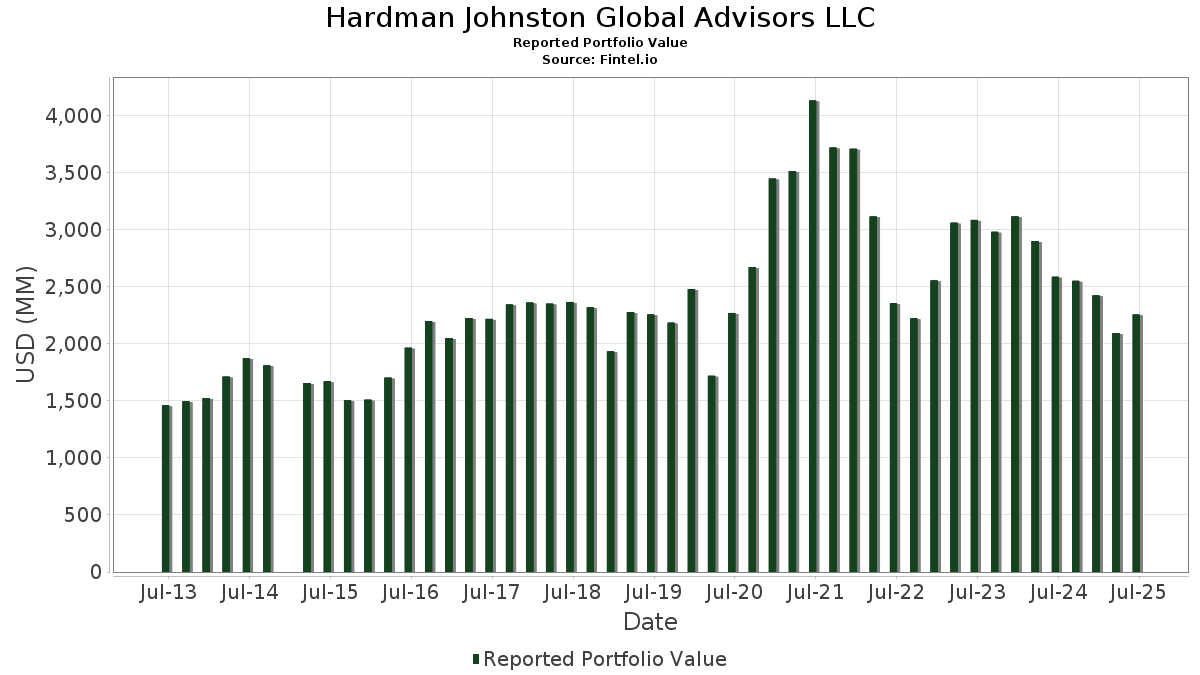
| Portfolio Value | $ 2,255,426,078 |
| Current Positions | 73 |
Latest Holdings, Performance, AUM (from 13F, 13D)
Hardman Johnston Global Advisors LLC has disclosed 73 total holdings in their latest SEC filings. Most recent portfolio value is calculated to be $ 2,255,426,078 USD. Actual Assets Under Management (AUM) is this value plus cash (which is not disclosed). Hardman Johnston Global Advisors LLC’s top holdings are MercadoLibre, Inc. (US:MELI) , ICICI Bank Limited - Depositary Receipt (Common Stock) (US:IBN) , HDFC Bank Limited - Depositary Receipt (Common Stock) (US:HDB) , ASML Holding N.V. - Depositary Receipt (Common Stock) (US:ASML) , and Direxion Shares ETF Trust - Direxion Daily NVDA Bear 1X Shares (US:NVDD) . Hardman Johnston Global Advisors LLC’s new positions include GE Vernova Inc. (US:GEV) , .
Top Increases This Quarter
We use the change in the portfolio allocation because this is the most meaningful metric. Changes can be due to trades or changes in share prices.
| Security | Shares (MM) |
Value (MM$) |
Portfolio % | ΔPortfolio % |
|---|---|---|---|---|
| 0.68 | 107.74 | 4.7768 | 1.7867 | |
| 0.07 | 183.63 | 8.1415 | 1.2199 | |
| 0.35 | 33.02 | 1.4642 | 0.7749 | |
| 0.12 | 56.73 | 2.5151 | 0.6643 | |
| 0.18 | 90.13 | 3.9960 | 0.6232 | |
| 5.21 | 175.13 | 7.7648 | 0.5710 | |
| 0.35 | 79.22 | 3.5125 | 0.4969 | |
| 0.41 | 52.23 | 2.3157 | 0.4695 | |
| 0.15 | 122.71 | 5.4408 | 0.4528 | |
| 0.41 | 32.19 | 1.4273 | 0.4031 |
Top Decreases This Quarter
We use the change in the portfolio allocation because this is the most meaningful metric. Changes can be due to trades or changes in share prices.
| Security | Shares (MM) |
Value (MM$) |
Portfolio % | ΔPortfolio % |
|---|---|---|---|---|
| 0.49 | 99.33 | 4.4040 | -0.8890 | |
| 0.03 | 8.36 | 0.3706 | -0.8108 | |
| 0.09 | 7.26 | 0.3218 | -0.6844 | |
| 0.11 | 48.18 | 2.1363 | -0.5986 | |
| 1.94 | 148.79 | 6.5969 | -0.5474 | |
| 0.13 | 71.04 | 3.1497 | -0.4928 | |
| 0.11 | 25.06 | 1.1112 | -0.4854 | |
| 0.13 | 31.98 | 1.4179 | -0.4836 | |
| 0.20 | 43.69 | 1.9371 | -0.3962 | |
| 0.23 | 47.29 | 2.0969 | -0.3545 |
13F and Fund Filings
This form was filed on 2025-07-21 for the reporting period 2025-06-30. Click the link icon to see the full transaction history.
Upgrade to unlock premium data and export to Excel ![]() .
.
| Security | Type | Avg Share Price | Shares (MM) |
ΔShares (%) |
ΔShares (%) |
Value ($MM) |
Portfolio (%) |
ΔPortfolio (%) |
|
|---|---|---|---|---|---|---|---|---|---|
| MELI / MercadoLibre, Inc. | 0.07 | -5.40 | 183.63 | 26.74 | 8.1415 | 1.2199 | |||
| IBN / ICICI Bank Limited - Depositary Receipt (Common Stock) | 5.21 | 8.97 | 175.13 | 16.30 | 7.7648 | 0.5710 | |||
| HDB / HDFC Bank Limited - Depositary Receipt (Common Stock) | 1.94 | -13.78 | 148.79 | -0.51 | 6.5969 | -0.5474 | |||
| ASML / ASML Holding N.V. - Depositary Receipt (Common Stock) | 0.15 | -2.82 | 122.71 | 17.53 | 5.4408 | 0.4528 | |||
| NVDD / Direxion Shares ETF Trust - Direxion Daily NVDA Bear 1X Shares | 0.68 | 18.08 | 107.74 | 72.13 | 4.7768 | 1.7867 | |||
| HWM / Howmet Aerospace Inc. | 0.57 | -26.93 | 106.56 | 4.83 | 4.7247 | -0.1315 | |||
| TEAM / Atlassian Corporation | 0.49 | -6.32 | 99.33 | -10.35 | 4.4040 | -0.8890 | |||
| MSFT / Microsoft Corporation | 0.18 | -3.66 | 90.13 | 27.66 | 3.9960 | 0.6232 | |||
| TSM / Taiwan Semiconductor Manufacturing Company Limited - Depositary Receipt (Common Stock) | 0.35 | -8.01 | 79.22 | 25.50 | 3.5125 | 0.4969 | |||
| MA / Mastercard Incorporated | 0.13 | -9.12 | 71.04 | -6.83 | 3.1497 | -0.4928 | |||
| GOOGL / Alphabet Inc. | 0.36 | -13.17 | 64.25 | -1.05 | 2.8487 | -0.2532 | |||
| CTVA / Corteva, Inc. | 0.84 | -4.08 | 62.94 | 13.61 | 2.7906 | 0.1439 | |||
| CW / Curtiss-Wright Corporation | 0.12 | -4.91 | 56.73 | 46.43 | 2.5151 | 0.6643 | |||
| VRT / Vertiv Holdings Co | 0.41 | -24.01 | 52.23 | 35.15 | 2.3157 | 0.4695 | |||
| VRTX / Vertex Pharmaceuticals Incorporated | 0.11 | -8.35 | 48.18 | -15.84 | 2.1363 | -0.5986 | |||
| AAPL / Apple Inc. | 0.23 | -0.22 | 47.29 | -7.83 | 2.0969 | -0.3545 | |||
| MMC / Marsh & McLennan Companies, Inc. | 0.20 | -0.16 | 43.69 | -10.54 | 1.9371 | -0.3962 | |||
| SCHW / The Charles Schwab Corporation | 0.44 | 0.29 | 40.53 | 16.90 | 1.7972 | 0.1407 | |||
| OLED / Universal Display Corporation | 0.26 | 0.20 | 40.49 | 10.96 | 1.7953 | 0.0519 | |||
| META / Meta Platforms, Inc. | 0.05 | -3.90 | 39.43 | 23.06 | 1.7483 | 0.2176 | |||
| AZN / AstraZeneca PLC - Depositary Receipt (Common Stock) | 0.55 | -1.64 | 38.62 | -6.49 | 1.7123 | -0.2607 | |||
| ADP / Automatic Data Processing, Inc. | 0.12 | -0.62 | 38.08 | 0.31 | 1.6882 | -0.1252 | |||
| UBER / Uber Technologies, Inc. | 0.35 | 78.73 | 33.02 | 128.87 | 1.4642 | 0.7749 | |||
| EW / Edwards Lifesciences Corporation | 0.41 | 39.16 | 32.19 | 50.16 | 1.4273 | 0.4031 | |||
| TMUS / T-Mobile US, Inc. | 0.13 | -10.06 | 31.98 | -19.65 | 1.4179 | -0.4836 | |||
| PYPL / PayPal Holdings, Inc. | 0.39 | 3.26 | 28.87 | 17.61 | 1.2802 | 0.1073 | |||
| ADBE / Adobe Inc. | 0.07 | 8.17 | 27.31 | 9.11 | 1.2110 | 0.0151 | |||
| SN / SharkNinja, Inc. | 0.26 | 7.33 | 26.16 | 27.37 | 1.1601 | 0.1787 | |||
| BSX / Boston Scientific Corporation | 0.23 | -18.71 | 25.08 | -13.45 | 1.1120 | -0.2724 | |||
| AMZN / Amazon.com, Inc. | 0.11 | -34.97 | 25.06 | -25.01 | 1.1112 | -0.4854 | |||
| BAC / Bank of America Corporation | 0.50 | -9.75 | 23.70 | 2.34 | 1.0510 | -0.0555 | |||
| AEIS / Advanced Energy Industries, Inc. | 0.17 | -0.05 | 22.81 | 38.96 | 1.0115 | 0.2272 | |||
| IQV / IQVIA Holdings Inc. | 0.14 | -0.02 | 22.57 | -10.64 | 1.0007 | -0.2058 | |||
| CMCSA / Comcast Corporation | 0.62 | -1.90 | 22.04 | -5.11 | 0.9773 | -0.1325 | |||
| ILMN / Illumina, Inc. | 0.18 | 23.00 | 17.63 | 47.92 | 0.7818 | 0.2123 | |||
| HXL / Hexcel Corporation | 0.30 | 29.30 | 17.04 | 33.39 | 0.7555 | 0.1452 | |||
| MDT / Medtronic plc | 0.19 | -0.07 | 16.26 | -3.06 | 0.7210 | -0.0804 | |||
| LLY / Eli Lilly and Company | 0.02 | -2.13 | 13.84 | -7.63 | 0.6134 | -0.1021 | |||
| BDX / Becton, Dickinson and Company | 0.08 | -0.04 | 13.46 | -24.83 | 0.5966 | -0.2586 | |||
| NVO / Novo Nordisk A/S - Depositary Receipt (Common Stock) | 0.15 | 33.02 | 10.34 | 32.22 | 0.4586 | 0.0849 | |||
| SWK / Stanley Black & Decker, Inc. | 0.13 | -0.52 | 9.05 | -12.34 | 0.4011 | -0.0919 | |||
| UNH / UnitedHealth Group Incorporated | 0.03 | -43.26 | 8.36 | -66.21 | 0.3706 | -0.8108 | |||
| FMC / FMC Corporation | 0.19 | -0.21 | 8.02 | -1.26 | 0.3556 | -0.0324 | |||
| MRVL / Marvell Technology, Inc. | 0.09 | -72.59 | 7.26 | -65.54 | 0.3218 | -0.6844 | |||
| ALB / Albemarle Corporation | 0.11 | -0.75 | 7.18 | -13.63 | 0.3183 | -0.0788 | |||
| ELV / Elevance Health, Inc. | 0.02 | 6.84 | 0.3033 | 0.3033 | |||||
| GOOG / Alphabet Inc. | 0.04 | 0.00 | 6.34 | 13.55 | 0.2813 | 0.0144 | |||
| ABT / Abbott Laboratories | 0.05 | 0.00 | 6.13 | 2.53 | 0.2716 | -0.0138 | |||
| EPD / Enterprise Products Partners L.P. - Limited Partnership | 0.19 | -0.05 | 5.95 | -9.22 | 0.2638 | -0.0493 | |||
| BIL / SPDR Series Trust - SPDR Bloomberg 1-3 Month T-Bill ETF | 0.04 | -57.83 | 3.21 | -57.84 | 0.1423 | -0.2214 | |||
| SLB / Schlumberger Limited | 0.09 | 0.00 | 3.09 | -19.13 | 0.1368 | -0.0455 | |||
| PLD / Prologis, Inc. | 0.03 | 0.00 | 2.94 | -5.97 | 0.1305 | -0.0190 | |||
| GJR / Strats Trust For Procter & Gambel Security - Preferred Security | 0.02 | 0.00 | 2.66 | -6.54 | 0.1180 | -0.0180 | |||
| MTB / M&T Bank Corporation | 0.01 | 0.00 | 2.06 | 8.53 | 0.0914 | 0.0007 | |||
| CCJ / Cameco Corporation | 0.02 | -10.11 | 1.61 | 62.13 | 0.0714 | 0.0240 | |||
| OKE / ONEOK, Inc. | 0.01 | 0.00 | 1.03 | -17.77 | 0.0458 | -0.0142 | |||
| MRK / Merck & Co., Inc. | 0.01 | 0.00 | 1.01 | -11.80 | 0.0447 | -0.0099 | |||
| XOM / Exxon Mobil Corporation | 0.01 | 0.00 | 0.96 | -9.37 | 0.0425 | -0.0080 | |||
| CVX / Chevron Corporation | 0.01 | 0.00 | 0.77 | -14.40 | 0.0343 | -0.0089 | |||
| MCHP / Microchip Technology Incorporated | 0.01 | -51.75 | 0.49 | -29.91 | 0.0215 | -0.0115 | |||
| HSY / The Hershey Company | 0.00 | 0.00 | 0.48 | -2.83 | 0.0213 | -0.0024 | |||
| BA / The Boeing Company | 0.00 | 0.42 | 0.0184 | 0.0184 | |||||
| GE / General Electric Company | 0.00 | -11.45 | 0.40 | 13.75 | 0.0176 | 0.0009 | |||
| NBIS / Nebius Group N.V. | 0.01 | 0.39 | 0.0174 | 0.0174 | |||||
| BABA / Alibaba Group Holding Limited - Depositary Receipt (Common Stock) | 0.00 | -7.10 | 0.37 | -20.43 | 0.0164 | -0.0058 | |||
| SHEL / Shell plc - Depositary Receipt (Common Stock) | 0.01 | 0.00 | 0.35 | -3.83 | 0.0156 | -0.0019 | |||
| TCOM / Trip.com Group Limited - Depositary Receipt (Common Stock) | 0.01 | -18.90 | 0.34 | -25.11 | 0.0149 | -0.0066 | |||
| AVGO / Broadcom Inc. | 0.00 | 0.00 | 0.33 | 65.00 | 0.0147 | 0.0051 | |||
| HIW / Highwoods Properties, Inc. | 0.01 | 0.00 | 0.30 | 4.88 | 0.0134 | -0.0004 | |||
| GEV / GE Vernova Inc. | 0.00 | 0.27 | 0.0120 | 0.0120 | |||||
| EMR / Emerson Electric Co. | 0.00 | 0.24 | 0.0106 | 0.0106 | |||||
| PAYX / Paychex, Inc. | 0.00 | 0.00 | 0.23 | -5.69 | 0.0103 | -0.0015 | |||
| IAU / iShares Gold Trust | 0.00 | 0.00 | 0.22 | 5.66 | 0.0100 | -0.0002 | |||
| GMAB / Genmab A/S - Depositary Receipt (Common Stock) | 0.00 | -100.00 | 0.00 | 0.0000 | |||||
| HD / The Home Depot, Inc. | 0.00 | -100.00 | 0.00 | 0.0000 | |||||
| ELAN / Elanco Animal Health Incorporated | 0.00 | -100.00 | 0.00 | 0.0000 | |||||
| EFA / iShares Trust - iShares MSCI EAFE ETF | 0.00 | -100.00 | 0.00 | 0.0000 | |||||
| BN / Brookfield Corporation | 0.00 | -100.00 | 0.00 | 0.0000 |