Basic Stats
| Portfolio Value | $ 2,500,243,947 |
| Current Positions | 49 |
Latest Holdings, Performance, AUM (from 13F, 13D)
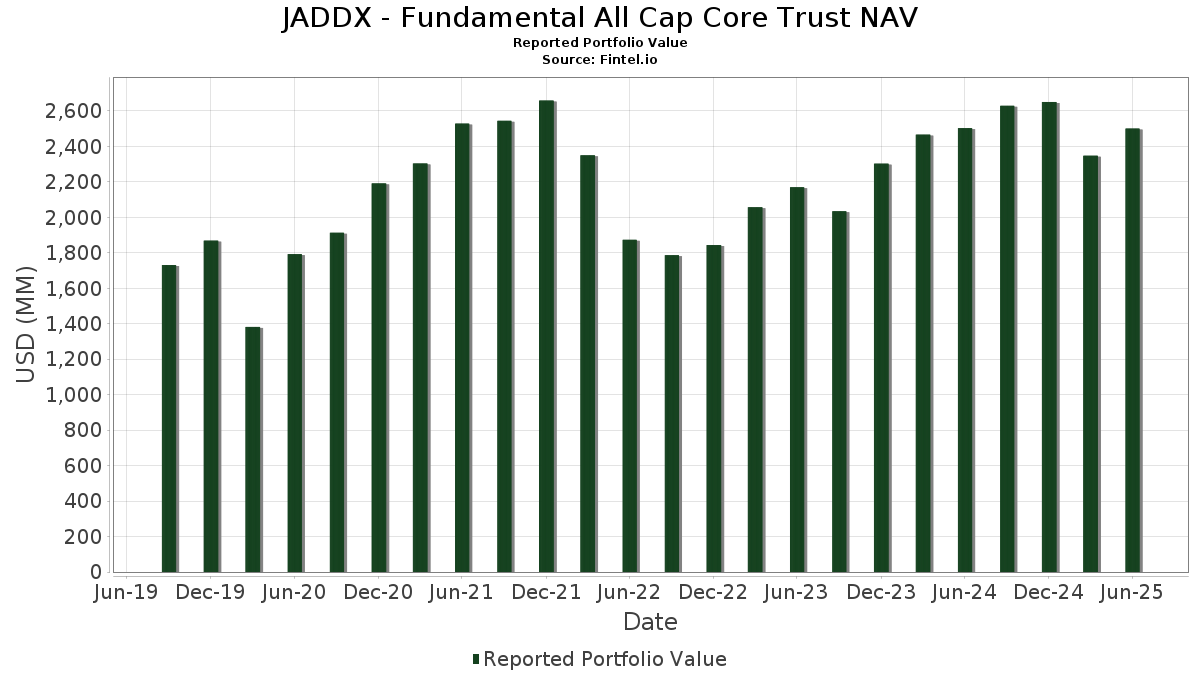
JADDX - Fundamental All Cap Core Trust NAV has disclosed 49 total holdings in their latest SEC filings. Most recent portfolio value is calculated to be $ 2,500,243,947 USD. Actual Assets Under Management (AUM) is this value plus cash (which is not disclosed). JADDX - Fundamental All Cap Core Trust NAV’s top holdings are Amazon.com, Inc. (US:AMZN) , NVIDIA Corporation (US:NVDA) , Alphabet Inc. (US:GOOGL) , KKR & Co. Inc. (US:KKR) , and Cheniere Energy, Inc. (US:LNG) . JADDX - Fundamental All Cap Core Trust NAV’s new positions include CarMax, Inc. (US:KMX) , McKesson Corporation (US:MCK) , .
Top Increases This Quarter
We use the change in the portfolio allocation because this is the most meaningful metric. Changes can be due to trades or changes in share prices.
| Security | Shares (MM) |
Value (MM$) |
Portfolio % | ΔPortfolio % |
|---|---|---|---|---|
| 1.27 | 82.79 | 3.3103 | 2.0317 | |
| 0.56 | 37.47 | 1.4981 | 1.4981 | |
| 0.04 | 27.04 | 1.0812 | 1.0812 | |
| 0.09 | 37.56 | 1.5019 | 1.0010 | |
| 0.26 | 56.62 | 2.2641 | 0.6837 | |
| 1.19 | 187.54 | 7.4992 | 0.6124 | |
| 0.11 | 42.09 | 1.6830 | 0.5077 | |
| 0.37 | 40.21 | 1.6080 | 0.4392 | |
| 0.77 | 102.47 | 4.0973 | 0.2460 | |
| 0.06 | 30.85 | 1.2335 | 0.2174 |
Top Decreases This Quarter
We use the change in the portfolio allocation because this is the most meaningful metric. Changes can be due to trades or changes in share prices.
| Security | Shares (MM) |
Value (MM$) |
Portfolio % | ΔPortfolio % |
|---|---|---|---|---|
| 0.32 | 32.57 | 1.3023 | -1.4384 | |
| 0.76 | 84.07 | 3.3618 | -1.3708 | |
| 0.48 | 98.62 | 3.9435 | -0.7169 | |
| 0.40 | 56.83 | 2.2723 | -0.6941 | |
| 0.95 | 209.39 | 8.3728 | -0.5826 | |
| 0.16 | 15.79 | 0.6315 | -0.2398 | |
| 3.59 | 89.72 | 3.5875 | -0.2118 | |
| 0.41 | 98.64 | 3.9442 | -0.2068 | |
| 2.78 | 37.40 | 1.4955 | -0.1737 | |
| 0.21 | 57.60 | 2.3031 | -0.1709 |
13F and Fund Filings
This form was filed on 2025-08-28 for the reporting period 2025-06-30. Click the link icon to see the full transaction history.
Upgrade to unlock premium data and export to Excel ![]() .
.
| Security | Type | Avg Share Price | Shares (MM) |
ΔShares (%) |
ΔShares (%) |
Value ($MM) |
Portfolio (%) |
ΔPortfolio (%) |
|
|---|---|---|---|---|---|---|---|---|---|
| AMZN / Amazon.com, Inc. | 0.95 | -13.64 | 209.39 | -0.42 | 8.3728 | -0.5826 | |||
| NVDA / NVIDIA Corporation | 1.19 | -20.44 | 187.54 | 15.98 | 7.4992 | 0.6124 | |||
| GOOGL / Alphabet Inc. | 0.71 | -2.43 | 125.62 | 11.20 | 5.0230 | 0.2118 | |||
| KKR / KKR & Co. Inc. | 0.77 | -1.53 | 102.47 | 13.31 | 4.0973 | 0.2460 | |||
| LNG / Cheniere Energy, Inc. | 0.41 | -2.43 | 99.81 | 2.68 | 3.9909 | -0.1486 | |||
| WDAY / Workday, Inc. | 0.41 | -1.53 | 98.64 | 1.20 | 3.9442 | -0.2068 | |||
| AAPL / Apple Inc. | 0.48 | -2.43 | 98.62 | -9.88 | 3.9435 | -0.7169 | |||
| FHB / First Hawaiian, Inc. | 3.59 | -1.53 | 89.72 | 0.57 | 3.5875 | -0.2118 | |||
| LEN / Lennar Corporation | 0.76 | -21.49 | 84.07 | -24.34 | 3.3618 | -1.3708 | |||
| HOLX / Hologic, Inc. | 1.27 | 161.39 | 82.79 | 175.74 | 3.3103 | 2.0317 | |||
| ADI / Analog Devices, Inc. | 0.29 | -2.43 | 68.23 | 15.16 | 2.7282 | 0.2050 | |||
| FWONK / Formula One Group | 0.63 | -2.43 | 65.70 | 13.28 | 2.6270 | 0.1571 | |||
| GPI / Group 1 Automotive, Inc. | 0.15 | -2.43 | 64.12 | 11.56 | 2.5638 | 0.1162 | |||
| CRM / Salesforce, Inc. | 0.21 | -2.43 | 57.60 | -0.85 | 2.3031 | -0.1709 | |||
| MS / Morgan Stanley | 0.40 | -32.43 | 56.83 | -18.42 | 2.2723 | -0.6941 | |||
| ORCL / Oracle Corporation | 0.26 | -2.43 | 56.62 | 52.58 | 2.2641 | 0.6837 | |||
| URI / United Rentals, Inc. | 0.07 | -2.42 | 54.88 | 17.30 | 2.1944 | 0.2020 | |||
| ADBE / Adobe Inc. | 0.12 | -2.43 | 46.30 | -1.57 | 1.8512 | -0.1520 | |||
| GS / The Goldman Sachs Group, Inc. | 0.06 | -21.61 | 45.21 | 1.56 | 1.8078 | -0.0880 | |||
| ELV / Elevance Health, Inc. | 0.11 | 70.56 | 42.09 | 52.52 | 1.6830 | 0.5077 | |||
| SPGI / S&P Global Inc. | 0.08 | -2.43 | 41.62 | 1.26 | 1.6641 | -0.0862 | |||
| POST / Post Holdings, Inc. | 0.37 | 56.38 | 40.21 | 46.54 | 1.6080 | 0.4392 | |||
| TMO / Thermo Fisher Scientific Inc. | 0.09 | 291.89 | 37.56 | 219.33 | 1.5019 | 1.0010 | |||
| KMX / CarMax, Inc. | 0.56 | 37.47 | 1.4981 | 1.4981 | |||||
| AVTR / Avantor, Inc. | 2.78 | 14.92 | 37.40 | -4.57 | 1.4955 | -0.1737 | |||
| MBLY / Mobileye Global Inc. | 2.05 | -2.43 | 36.80 | 21.87 | 1.4715 | 0.1855 | |||
| BUD / Anheuser-Busch InBev SA/NV - Depositary Receipt (Common Stock) | 0.52 | -2.43 | 35.79 | 8.92 | 1.4311 | 0.0317 | |||
| TXN / Texas Instruments Incorporated | 0.17 | -2.43 | 34.49 | 12.73 | 1.3792 | 0.0762 | |||
| MTN / Vail Resorts, Inc. | 0.21 | -2.43 | 33.10 | -4.19 | 1.3237 | -0.1478 | |||
| CCI / Crown Castle Inc. | 0.32 | -48.65 | 32.57 | -49.39 | 1.3023 | -1.4384 | |||
| ADSK / Autodesk, Inc. | 0.10 | -2.43 | 32.46 | 15.38 | 1.2979 | 0.0998 | |||
| MSFT / Microsoft Corporation | 0.06 | -2.42 | 30.85 | 29.29 | 1.2335 | 0.2174 | |||
| WBD / Warner Bros. Discovery, Inc. | 2.63 | -1.53 | 30.11 | 5.17 | 1.2039 | -0.0153 | |||
| RRX / Regal Rexnord Corporation | 0.21 | -2.43 | 29.88 | 24.23 | 1.1947 | 0.1705 | |||
| ROP / Roper Technologies, Inc. | 0.05 | -2.42 | 29.13 | -6.19 | 1.1647 | -0.1576 | |||
| DUFN / Dufry AG | 0.53 | -2.43 | 29.10 | 21.33 | 1.1635 | 0.1422 | |||
| 005930 / Samsung Electronics Co., Ltd. | 0.64 | -2.43 | 28.39 | 8.84 | 1.1353 | 0.0243 | |||
| SU / Suncor Energy Inc. | 0.75 | -2.43 | 28.21 | -5.63 | 1.1282 | -0.1451 | |||
| MCK / McKesson Corporation | 0.04 | 27.04 | 1.0812 | 1.0812 | |||||
| LVS / Las Vegas Sands Corp. | 0.58 | -2.43 | 25.25 | 9.90 | 1.0098 | 0.0312 | |||
| GOOS / Canada Goose Holdings Inc. | 2.07 | -2.43 | 23.20 | 37.34 | 0.9275 | 0.2082 | |||
| CARG / CarGurus, Inc. | 0.65 | -2.43 | 21.91 | 12.11 | 0.8761 | 0.0438 | |||
| DEO / Diageo plc - Depositary Receipt (Common Stock) | 0.16 | 55.41 | 15.79 | -22.85 | 0.6315 | -0.2398 | |||
| MRP / Millrose Properties, Inc. | 0.37 | -2.43 | 10.48 | 4.93 | 0.4192 | -0.0063 | |||
| ELAN / Elanco Animal Health Incorporated | 0.72 | -2.43 | 10.30 | 32.71 | 0.4118 | 0.0813 | |||
| FOXF / Fox Factory Holding Corp. | 0.39 | -2.43 | 10.23 | 8.44 | 0.4090 | 0.0073 | |||
| FPH / Five Point Holdings, LLC | 1.77 | -2.43 | 9.74 | 0.50 | 0.3896 | -0.0233 | |||
| SFER / Salvatore Ferragamo S.p.A. | 0.67 | -2.43 | 3.93 | -14.81 | 0.1571 | -0.0393 | |||
| JH COLLATERAL / STIV (N/A) | 0.10 | 1.00 | 0.0399 | 0.0399 |