Basic Stats
| Portfolio Value | $ 2,117,097,914 |
| Current Positions | 67 |
Latest Holdings, Performance, AUM (from 13F, 13D)
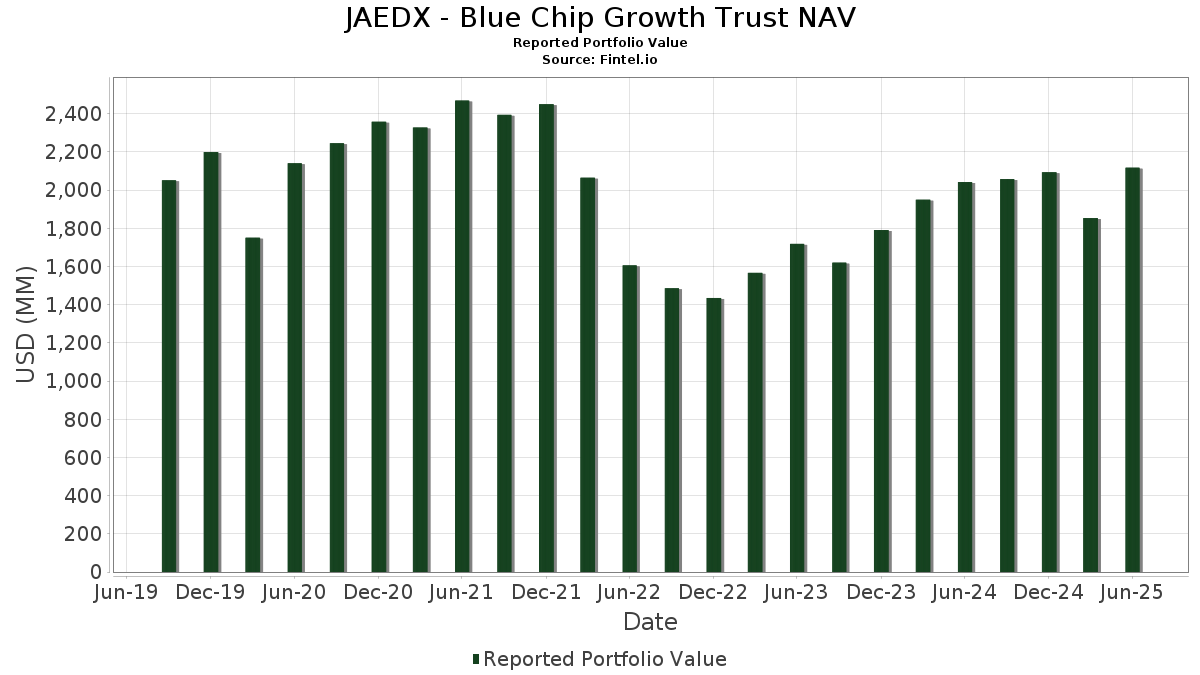
JAEDX - Blue Chip Growth Trust NAV has disclosed 67 total holdings in their latest SEC filings. Most recent portfolio value is calculated to be $ 2,117,097,914 USD. Actual Assets Under Management (AUM) is this value plus cash (which is not disclosed). JAEDX - Blue Chip Growth Trust NAV’s top holdings are NVIDIA Corporation (US:NVDA) , Microsoft Corporation (US:MSFT) , Apple Inc. (US:AAPL) , Amazon.com, Inc. (US:AMZN) , and Meta Platforms, Inc. (US:META) . JAEDX - Blue Chip Growth Trust NAV’s new positions include Carvana Co. (US:US146869AM47) , Carvana Co. (US:US146869AN20) , Carvana Co. (US:US146869AL63) , .
Top Increases This Quarter
We use the change in the portfolio allocation because this is the most meaningful metric. Changes can be due to trades or changes in share prices.
| Security | Shares (MM) |
Value (MM$) |
Portfolio % | ΔPortfolio % |
|---|---|---|---|---|
| 1.88 | 296.69 | 14.0119 | 3.3390 | |
| 0.59 | 291.66 | 13.7741 | 2.2350 | |
| 0.19 | 141.62 | 6.6885 | 1.8788 | |
| 0.24 | 66.06 | 3.1196 | 1.1404 | |
| 0.20 | 65.91 | 3.1129 | 0.9316 | |
| 0.13 | 34.72 | 1.6398 | 0.7879 | |
| 0.05 | 62.17 | 2.9361 | 0.5045 | |
| 0.02 | 12.59 | 0.5948 | 0.3263 | |
| 0.06 | 18.84 | 0.8899 | 0.1987 | |
| 0.04 | 44.07 | 2.0813 | 0.1654 |
Top Decreases This Quarter
We use the change in the portfolio allocation because this is the most meaningful metric. Changes can be due to trades or changes in share prices.
| Security | Shares (MM) |
Value (MM$) |
Portfolio % | ΔPortfolio % |
|---|---|---|---|---|
| 0.43 | 75.58 | 3.5694 | -2.0684 | |
| 0.80 | 163.34 | 7.7142 | -1.6003 | |
| 0.68 | 150.27 | 7.0969 | -1.2851 | |
| 0.05 | 14.77 | 0.6978 | -0.8440 | |
| 0.08 | 59.76 | 2.8225 | -0.7302 | |
| 0.19 | 66.91 | 3.1598 | -0.4995 | |
| 1.36 | 1.36 | 0.0644 | -0.4633 | |
| 0.09 | 50.12 | 2.3668 | -0.3764 | |
| 0.09 | 21.14 | 0.9982 | -0.3356 | |
| 0.07 | 19.38 | 0.9151 | -0.2387 |
13F and Fund Filings
This form was filed on 2025-08-28 for the reporting period 2025-06-30. Click the link icon to see the full transaction history.
Upgrade to unlock premium data and export to Excel ![]() .
.
| Security | Type | Avg Share Price | Shares (MM) |
ΔShares (%) |
ΔShares (%) |
Value ($MM) |
Portfolio (%) |
ΔPortfolio (%) |
|
|---|---|---|---|---|---|---|---|---|---|
| NVDA / NVIDIA Corporation | 1.88 | 2.88 | 296.69 | 49.98 | 14.0119 | 3.3390 | |||
| MSFT / Microsoft Corporation | 0.59 | 2.91 | 291.66 | 36.36 | 13.7741 | 2.2350 | |||
| AAPL / Apple Inc. | 0.80 | 2.43 | 163.34 | -5.39 | 7.7142 | -1.6003 | |||
| AMZN / Amazon.com, Inc. | 0.68 | -16.12 | 150.27 | -3.28 | 7.0969 | -1.2851 | |||
| META / Meta Platforms, Inc. | 0.19 | 24.05 | 141.62 | 58.86 | 6.6885 | 1.8788 | |||
| GOOG / Alphabet Inc. | 0.43 | -36.30 | 75.58 | -27.67 | 3.5694 | -2.0684 | |||
| V / Visa Inc. | 0.19 | -2.63 | 66.91 | -1.35 | 3.1598 | -0.4995 | |||
| AVGO / Broadcom Inc. | 0.24 | 9.37 | 66.06 | 80.06 | 3.1196 | 1.1404 | |||
| CVNA / Carvana Co. | 0.20 | 1.16 | 65.91 | 63.03 | 3.1129 | 0.9316 | |||
| NFLX / Netflix, Inc. | 0.05 | -3.94 | 62.17 | 37.94 | 2.9361 | 0.5045 | |||
| LLY / Eli Lilly and Company | 0.08 | -3.84 | 59.76 | -9.24 | 2.8225 | -0.7302 | |||
| MA / Mastercard Incorporated | 0.09 | -3.86 | 50.12 | -1.44 | 2.3668 | -0.3764 | |||
| TSLA / Tesla, Inc. | 0.15 | -2.55 | 49.12 | 19.45 | 2.3197 | 0.1013 | |||
| NOW / ServiceNow, Inc. | 0.04 | -3.90 | 44.07 | 24.10 | 2.0813 | 0.1654 | |||
| GE / General Electric Company | 0.13 | 70.98 | 34.72 | 119.88 | 1.6398 | 0.7879 | |||
| ISRG / Intuitive Surgical, Inc. | 0.06 | -4.75 | 31.84 | 4.51 | 1.5037 | -0.1399 | |||
| BKNG / Booking Holdings Inc. | 0.00 | -4.27 | 22.07 | 20.30 | 1.0422 | 0.0525 | |||
| TMUS / T-Mobile US, Inc. | 0.09 | -4.30 | 21.14 | -14.50 | 0.9982 | -0.3356 | |||
| GOOGL / Alphabet Inc. | 0.12 | -13.43 | 20.38 | -1.35 | 0.9626 | -0.1520 | |||
| CB / Chubb Limited | 0.07 | -5.56 | 19.38 | -9.40 | 0.9151 | -0.2387 | |||
| CEG / Constellation Energy Corporation | 0.06 | -8.12 | 18.84 | 47.09 | 0.8899 | 0.1987 | |||
| ASML / ASML Holding N.V. - Depositary Receipt (Common Stock) | 0.02 | -4.19 | 17.91 | 15.87 | 0.8456 | 0.0119 | |||
| CMG / Chipotle Mexican Grill, Inc. | 0.30 | -2.51 | 16.77 | 9.02 | 0.7920 | -0.0379 | |||
| SNPS / Synopsys, Inc. | 0.03 | -4.69 | 16.59 | 13.94 | 0.7836 | -0.0020 | |||
| SHOP / Shopify Inc. | 0.14 | -2.70 | 16.05 | 17.67 | 0.7578 | 0.0221 | |||
| INTU / Intuit Inc. | 0.02 | -2.89 | 15.51 | 24.57 | 0.7324 | 0.0608 | |||
| UNH / UnitedHealth Group Incorporated | 0.05 | -13.20 | 14.77 | -48.30 | 0.6978 | -0.8440 | |||
| US76105Y1091 / T. Rowe Price Government Reserve Fund | 13.80 | 14.41 | 13.80 | 14.40 | 0.6517 | 0.0010 | |||
| GEV / GE Vernova Inc. | 0.02 | 45.99 | 12.59 | 153.04 | 0.5948 | 0.3263 | |||
| DASH / DoorDash, Inc. | 0.05 | -2.33 | 11.32 | 31.73 | 0.5346 | 0.0710 | |||
| DHR / Danaher Corporation | 0.06 | -6.77 | 11.00 | -10.17 | 0.5196 | -0.1411 | |||
| SYK / Stryker Corporation | 0.03 | -3.71 | 10.91 | 2.33 | 0.5151 | -0.0599 | |||
| ROP / Roper Technologies, Inc. | 0.02 | -3.04 | 10.74 | -6.78 | 0.5074 | -0.1144 | |||
| TSM / Taiwan Semiconductor Manufacturing Company Limited - Depositary Receipt (Common Stock) | 0.05 | -4.34 | 10.53 | 30.51 | 0.4972 | 0.0620 | |||
| SE / Sea Limited - Depositary Receipt (Common Stock) | 0.06 | -7.78 | 9.93 | 13.03 | 0.4691 | -0.0050 | |||
| TMO / Thermo Fisher Scientific Inc. | 0.02 | -6.55 | 9.49 | -23.86 | 0.4482 | -0.2242 | |||
| MPWR / Monolithic Power Systems, Inc. | 0.01 | -3.76 | 9.37 | 21.36 | 0.4425 | 0.0260 | |||
| MS / Morgan Stanley | 0.06 | -10.82 | 8.82 | 7.67 | 0.4166 | -0.0254 | |||
| CRWD / CrowdStrike Holdings, Inc. | 0.02 | 7.40 | 8.64 | 55.13 | 0.4079 | 0.1075 | |||
| TJX / The TJX Companies, Inc. | 0.07 | -3.76 | 8.58 | -2.43 | 0.4052 | -0.0692 | |||
| MMC / Marsh & McLennan Companies, Inc. | 0.04 | -4.08 | 8.03 | -14.06 | 0.3793 | -0.1249 | |||
| TEL / TE Connectivity plc | 0.05 | -8.25 | 8.01 | 9.50 | 0.3783 | -0.0163 | |||
| GS / The Goldman Sachs Group, Inc. | 0.01 | -28.02 | 7.80 | -6.75 | 0.3685 | -0.0829 | |||
| ROST / Ross Stores, Inc. | 0.06 | -4.30 | 7.70 | -4.45 | 0.3638 | -0.0712 | |||
| LIN / Linde plc | 0.02 | -5.05 | 7.67 | -4.33 | 0.3623 | -0.0703 | |||
| SCHW / The Charles Schwab Corporation | 0.08 | -5.39 | 7.59 | 10.27 | 0.3585 | -0.0129 | |||
| CL / Colgate-Palmolive Company | 0.08 | -4.09 | 7.40 | -6.96 | 0.3497 | -0.0797 | |||
| SHW / The Sherwin-Williams Company | 0.02 | -5.03 | 7.29 | -6.62 | 0.3443 | -0.0769 | |||
| SPGI / S&P Global Inc. | 0.01 | -8.71 | 7.11 | -5.27 | 0.3356 | -0.0691 | |||
| TXN / Texas Instruments Incorporated | 0.03 | 97.07 | 6.29 | 127.70 | 0.2970 | 0.1480 | |||
| TDG / TransDigm Group Incorporated | 0.00 | 0.00 | 6.28 | 9.94 | 0.2967 | -0.0116 | |||
| PG / The Procter & Gamble Company | 0.04 | -25.75 | 5.76 | -30.59 | 0.2718 | -0.1755 | |||
| CTAS / Cintas Corporation | 0.02 | 8.29 | 5.53 | 17.43 | 0.2613 | 0.0071 | |||
| MDLZ / Mondelez International, Inc. | 0.07 | 0.00 | 4.54 | -0.59 | 0.2145 | -0.0320 | |||
| ODFL / Old Dominion Freight Line, Inc. | 0.03 | -7.08 | 4.49 | -8.85 | 0.2121 | -0.0537 | |||
| ELV / Elevance Health, Inc. | 0.01 | -14.46 | 4.37 | -23.52 | 0.2065 | -0.1019 | |||
| 1N8 / Adyen N.V. | 0.00 | -8.19 | 4.14 | 10.00 | 0.1953 | -0.0075 | |||
| FI / Fiserv, Inc. | 0.02 | 0.00 | 4.08 | -21.93 | 0.1925 | -0.0892 | |||
| SLB / Schlumberger Limited | 0.10 | 0.00 | 3.38 | -19.15 | 0.1597 | -0.0659 | |||
| DDOG / Datadog, Inc. | 0.02 | 8.83 | 3.15 | 47.35 | 0.1486 | 0.0334 | |||
| PLTR / Palantir Technologies Inc. | 0.02 | 147.19 | 3.00 | 299.33 | 0.1416 | 0.1011 | |||
| US146869AM47 / Carvana Co. | 2.07 | 6.60 | 0.0976 | -0.0070 | |||||
| CFLT / Confluent, Inc. | 0.06 | 0.00 | 1.50 | 6.38 | 0.0709 | -0.0053 | |||
| US146869AN20 / Carvana Co. | 1.44 | -0.69 | 0.0678 | -0.0102 | |||||
| 7839989D1 / SSC GOVERNMENT MM GVMXX GVMXX | 1.36 | -86.06 | 1.36 | -86.07 | 0.0644 | -0.4633 | |||
| VLTO / Veralto Corporation | 0.01 | 0.00 | 1.35 | 3.60 | 0.0638 | -0.0066 | |||
| US146869AL63 / Carvana Co. | 0.80 | -0.38 | 0.0376 | -0.0055 |