Basic Stats
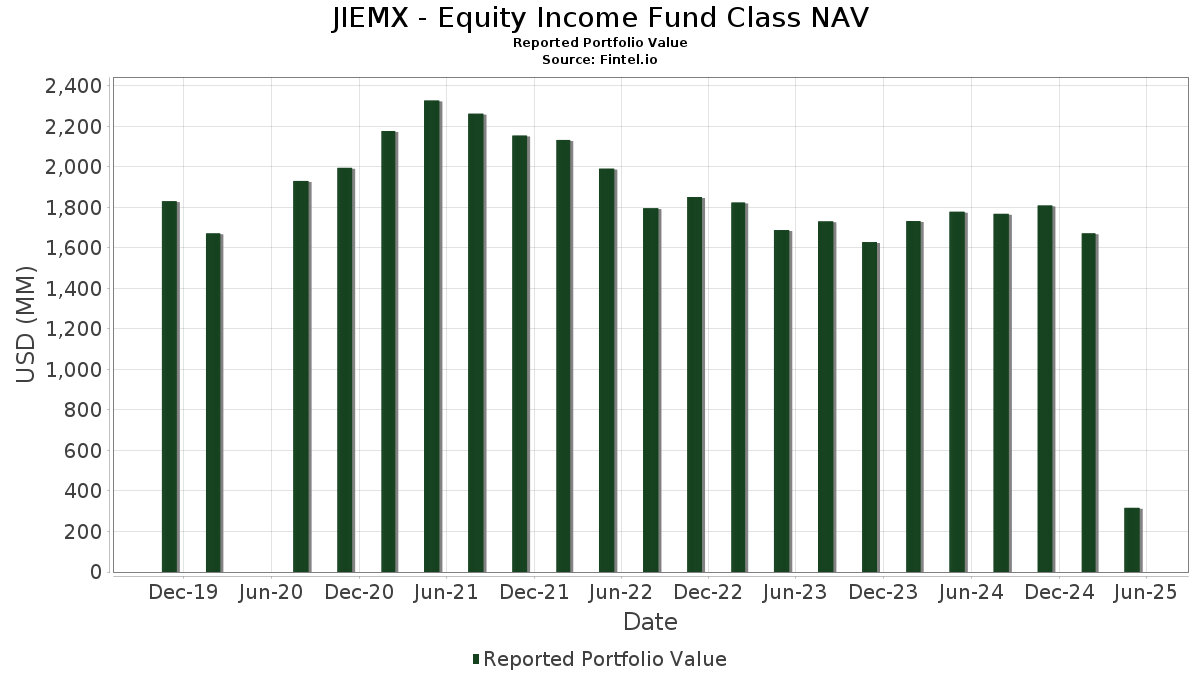
| Portfolio Value | $ 316,655,966 |
| Current Positions | 128 |
Latest Holdings, Performance, AUM (from 13F, 13D)
JIEMX - Equity Income Fund Class NAV has disclosed 128 total holdings in their latest SEC filings. Most recent portfolio value is calculated to be $ 316,655,966 USD. Actual Assets Under Management (AUM) is this value plus cash (which is not disclosed). JIEMX - Equity Income Fund Class NAV’s top holdings are General Electric Company (US:GE) , MetLife, Inc. (US:MET) , Wells Fargo & Company (US:WFC) , The Charles Schwab Corporation (US:SCHW) , and The Southern Company (US:SO) . JIEMX - Equity Income Fund Class NAV’s new positions include The Allstate Corporation (US:ALL) , The Procter & Gamble Company (US:PG) , Corebridge Financial, Inc. (US:CRBG) , Sun Communities, Inc. (US:SUI) , and Global Payments Inc. (US:GPN) .
Top Increases This Quarter
We use the change in the portfolio allocation because this is the most meaningful metric. Changes can be due to trades or changes in share prices.
| Security | Shares (MM) |
Value (MM$) |
Portfolio % | ΔPortfolio % |
|---|---|---|---|---|
| 0.04 | 2.73 | 0.8592 | 0.4252 | |
| 0.02 | 4.63 | 1.4560 | 0.3639 | |
| 0.01 | 1.10 | 0.3469 | 0.3469 | |
| 0.03 | 6.15 | 1.9325 | 0.3426 | |
| 0.01 | 1.04 | 0.3277 | 0.3277 | |
| 0.03 | 1.04 | 0.3259 | 0.3259 | |
| 0.02 | 1.55 | 0.4878 | 0.2958 | |
| 0.03 | 6.85 | 2.1535 | 0.2802 | |
| 0.08 | 6.63 | 2.0832 | 0.2750 | |
| 0.01 | 1.71 | 0.5377 | 0.2546 |
Top Decreases This Quarter
We use the change in the portfolio allocation because this is the most meaningful metric. Changes can be due to trades or changes in share prices.
| Security | Shares (MM) |
Value (MM$) |
Portfolio % | ΔPortfolio % |
|---|---|---|---|---|
| 0.00 | 0.24 | 0.0744 | -0.6090 | |
| 0.02 | 2.65 | 0.8319 | -0.5012 | |
| 0.52 | 0.52 | 0.1634 | -0.4680 | |
| 0.13 | 3.79 | 1.1909 | -0.4392 | |
| 0.01 | 2.46 | 0.7745 | -0.3732 | |
| 0.09 | 6.65 | 2.0920 | -0.3076 | |
| 0.03 | 4.47 | 1.4057 | -0.2872 | |
| 0.03 | 0.65 | 0.2044 | -0.2717 | |
| 0.15 | 3.78 | 1.1888 | -0.2458 | |
| 0.01 | 0.81 | 0.2552 | -0.2437 |
13F and Fund Filings
This form was filed on 2025-07-29 for the reporting period 2025-05-31. Click the link icon to see the full transaction history.
Upgrade to unlock premium data and export to Excel ![]() .
.
| Security | Type | Avg Share Price | Shares (MM) |
ΔShares (%) |
ΔShares (%) |
Value ($MM) |
Portfolio (%) |
ΔPortfolio (%) |
|
|---|---|---|---|---|---|---|---|---|---|
| GE / General Electric Company | 0.03 | -81.57 | 6.85 | -78.10 | 2.1535 | 0.2802 | |||
| MET / MetLife, Inc. | 0.09 | -80.60 | 6.80 | -82.31 | 2.1384 | -0.1647 | |||
| WFC / Wells Fargo & Company | 0.09 | -82.60 | 6.65 | -83.39 | 2.0920 | -0.3076 | |||
| SCHW / The Charles Schwab Corporation | 0.08 | -80.24 | 6.63 | -78.05 | 2.0832 | 0.2750 | |||
| SO / The Southern Company | 0.07 | -81.03 | 6.54 | -80.99 | 2.0567 | -0.0044 | |||
| KMB / Kimberly-Clark Corporation | 0.04 | -79.42 | 6.21 | -79.16 | 1.9535 | 0.1674 | |||
| LHX / L3Harris Technologies, Inc. | 0.03 | -80.47 | 6.15 | -76.84 | 1.9325 | 0.3426 | |||
| PM / Philip Morris International Inc. | 0.03 | -82.25 | 6.06 | -79.36 | 1.9050 | 0.1464 | |||
| CB / Chubb Limited | 0.02 | -80.17 | 5.97 | -79.35 | 1.8762 | 0.1450 | |||
| QCOM / QUALCOMM Incorporated | 0.04 | -79.54 | 5.88 | -81.10 | 1.8481 | -0.0144 | |||
| ELV / Elevance Health, Inc. | 0.02 | -80.46 | 5.86 | -81.11 | 1.8431 | -0.0152 | |||
| JPM / JPMorgan Chase & Co. | 0.02 | -80.37 | 5.64 | -80.42 | 1.7735 | 0.0482 | |||
| C / Citigroup Inc. | 0.07 | -78.81 | 5.44 | -80.03 | 1.7105 | 0.0784 | |||
| TTA / Time to Act Plc | 0.09 | -80.61 | 5.27 | -81.07 | 1.6567 | -0.0103 | |||
| EQR / Equity Residential | 0.07 | -79.14 | 4.97 | -80.27 | 1.5639 | 0.0538 | |||
| KVUE / Kenvue Inc. | 0.21 | -83.59 | 4.92 | -83.40 | 1.5480 | -0.2291 | |||
| CF / CF Industries Holdings, Inc. | 0.05 | -80.57 | 4.91 | -78.25 | 1.5435 | 0.1916 | |||
| AIG / American International Group, Inc. | 0.06 | -83.56 | 4.80 | -83.22 | 1.5078 | -0.2045 | |||
| HIG / The Hartford Insurance Group, Inc. | 0.04 | -81.96 | 4.67 | -80.20 | 1.4672 | 0.0553 | |||
| MSFT / Microsoft Corporation | 0.01 | -81.38 | 4.65 | -78.41 | 1.4626 | 0.1723 | |||
| BA / The Boeing Company | 0.02 | -78.61 | 4.63 | -74.60 | 1.4560 | 0.3639 | |||
| EQH / Equitable Holdings, Inc. | 0.09 | -82.63 | 4.63 | -83.31 | 1.4540 | -0.2059 | |||
| BDX / Becton, Dickinson and Company | 0.03 | -79.33 | 4.47 | -84.18 | 1.4057 | -0.2872 | |||
| XOM / Exxon Mobil Corporation | 0.04 | -81.00 | 4.45 | -82.54 | 1.4003 | -0.1280 | |||
| IP / International Paper Company | 0.09 | -80.05 | 4.41 | -83.07 | 1.3857 | -0.1737 | |||
| ZBH / Zimmer Biomet Holdings, Inc. | 0.05 | -80.35 | 4.38 | -82.64 | 1.3781 | -0.1338 | |||
| SMAWF / Siemens Aktiengesellschaft | 0.02 | -80.58 | 4.31 | -79.64 | 1.3534 | 0.0872 | |||
| AEE / Ameren Corporation | 0.04 | -80.49 | 4.00 | -81.39 | 1.2572 | -0.0301 | |||
| CVS / CVS Health Corporation | 0.06 | -80.35 | 3.84 | -80.86 | 1.2083 | 0.0058 | |||
| NWSA / News Corporation | 0.13 | -85.89 | 3.79 | -86.08 | 1.1909 | -0.4392 | |||
| HBAN / Huntington Bancshares Incorporated | 0.24 | -80.61 | 3.79 | -81.60 | 1.1899 | -0.0420 | |||
| WY / Weyerhaeuser Company | 0.15 | -81.66 | 3.78 | -84.21 | 1.1888 | -0.2458 | |||
| COP / ConocoPhillips | 0.04 | -75.60 | 3.78 | -79.00 | 1.1878 | 0.1105 | |||
| WMT / Walmart Inc. | 0.04 | -81.86 | 3.68 | -81.84 | 1.1574 | -0.0566 | |||
| DIS / The Walt Disney Company | 0.03 | -80.35 | 3.65 | -80.49 | 1.1467 | 0.0272 | |||
| SWK / Stanley Black & Decker, Inc. | 0.06 | -78.39 | 3.64 | -83.66 | 1.1445 | -0.1899 | |||
| LVS / Las Vegas Sands Corp. | 0.08 | -77.71 | 3.43 | -79.48 | 1.0772 | 0.0772 | |||
| CI / The Cigna Group | 0.01 | -79.63 | 3.41 | -79.12 | 1.0718 | 0.0939 | |||
| BAC / Bank of America Corporation | 0.07 | -80.58 | 3.29 | -81.41 | 1.0358 | -0.0256 | |||
| LUV / Southwest Airlines Co. | 0.10 | -80.85 | 3.29 | -79.42 | 1.0329 | 0.0767 | |||
| TXN / Texas Instruments Incorporated | 0.02 | -78.04 | 3.23 | -79.51 | 1.0141 | 0.0712 | |||
| L / Loews Corporation | 0.04 | -81.93 | 3.20 | -81.39 | 1.0072 | -0.0235 | |||
| CL / Colgate-Palmolive Company | 0.03 | -78.80 | 3.20 | -78.39 | 1.0071 | 0.1192 | |||
| MDT / Medtronic plc | 0.04 | -80.60 | 2.99 | -82.51 | 0.9399 | -0.0838 | |||
| FITB / Fifth Third Bancorp | 0.08 | -79.31 | 2.92 | -81.83 | 0.9188 | -0.0444 | |||
| ACN / Accenture plc | 0.01 | -77.45 | 2.86 | -79.50 | 0.8980 | 0.0634 | |||
| SRE / Sempra | 0.04 | -78.67 | 2.77 | -76.58 | 0.8707 | 0.1625 | |||
| CSX / CSX Corporation | 0.09 | -78.37 | 2.76 | -78.65 | 0.8686 | 0.0933 | |||
| FTV / Fortive Corporation | 0.04 | -57.26 | 2.73 | -62.30 | 0.8592 | 0.4252 | |||
| USB / U.S. Bancorp | 0.06 | -79.04 | 2.67 | -80.53 | 0.8409 | 0.0184 | |||
| FI / Fiserv, Inc. | 0.02 | -82.79 | 2.65 | -88.11 | 0.8319 | -0.5012 | |||
| 005930 / Samsung Electronics Co., Ltd. | 0.06 | -79.16 | 2.61 | -77.40 | 0.8216 | 0.1290 | |||
| D / Dominion Energy, Inc. | 0.04 | -82.34 | 2.50 | -82.33 | 0.7847 | -0.0612 | |||
| TSN / Tyson Foods, Inc. | 0.04 | -78.86 | 2.49 | -80.65 | 0.7824 | 0.0123 | |||
| UNH / UnitedHealth Group Incorporated | 0.01 | -79.77 | 2.46 | -87.15 | 0.7745 | -0.3732 | |||
| UPS / United Parcel Service, Inc. | 0.03 | -80.71 | 2.45 | -84.19 | 0.7687 | -0.1577 | |||
| VTRS / Viatris Inc. | 0.25 | -77.99 | 2.21 | -79.04 | 0.6932 | 0.0631 | |||
| JNJ / Johnson & Johnson | 0.01 | -82.08 | 2.18 | -83.15 | 0.6866 | -0.0896 | |||
| SAN / Santander UK plc - Preferred Stock | 0.02 | -82.93 | 2.17 | -84.53 | 0.6834 | -0.1581 | |||
| ROK / Rockwell Automation, Inc. | 0.01 | -77.93 | 2.13 | -75.76 | 0.6689 | 0.1433 | |||
| SLB / Schlumberger Limited | 0.06 | -73.91 | 2.13 | -79.31 | 0.6682 | 0.0532 | |||
| NEE / NextEra Energy, Inc. | 0.03 | -82.64 | 2.11 | -82.52 | 0.6634 | -0.0596 | |||
| AZN / AstraZeneca PLC - Depositary Receipt (Common Stock) | 0.03 | -82.43 | 2.11 | -83.22 | 0.6632 | -0.0895 | |||
| TEL / TE Connectivity plc | 0.01 | -86.66 | 2.03 | -86.14 | 0.6367 | -0.2383 | |||
| CMI / Cummins Inc. | 0.01 | -79.85 | 1.99 | -82.41 | 0.6259 | -0.0518 | |||
| EQT / EQT Corporation | 0.04 | -84.99 | 1.94 | -82.82 | 0.6105 | -0.0666 | |||
| WMB / The Williams Companies, Inc. | 0.03 | -83.50 | 1.91 | -82.84 | 0.6003 | -0.0661 | |||
| NSC / Norfolk Southern Corporation | 0.01 | -81.37 | 1.89 | -81.28 | 0.5931 | -0.0102 | |||
| AMAT / Applied Materials, Inc. | 0.01 | -80.10 | 1.87 | -80.28 | 0.5872 | 0.0202 | |||
| CMCSA / Comcast Corporation | 0.05 | -79.92 | 1.84 | -80.65 | 0.5778 | 0.0089 | |||
| RYN / Rayonier Inc. | 0.08 | -78.59 | 1.79 | -80.85 | 0.5620 | 0.0030 | |||
| REXR / Rexford Industrial Realty, Inc. | 0.05 | -75.70 | 1.77 | -79.28 | 0.5579 | 0.0451 | |||
| EXE / Expand Energy Corporation | 0.01 | -69.19 | 1.71 | -63.82 | 0.5377 | 0.2546 | |||
| BA.PRA / The Boeing Company - Preferred Security | 0.03 | -78.04 | 1.69 | -75.32 | 0.5311 | 0.1212 | |||
| ADBE / Adobe Inc. | 0.00 | -76.21 | 1.68 | -77.49 | 0.5277 | 0.0812 | |||
| VW-V / Volkswagen AG - Preferred Stock | 0.02 | -76.93 | 1.63 | -76.84 | 0.5123 | 0.0910 | |||
| STT / State Street Corporation | 0.02 | -50.11 | 1.55 | -51.61 | 0.4878 | 0.2958 | |||
| TRP / TC Energy Corporation | 0.03 | -80.49 | 1.53 | -77.93 | 0.4811 | 0.0659 | |||
| GEV / GE Vernova Inc. | 0.00 | -82.59 | 1.50 | -75.43 | 0.4716 | 0.1060 | |||
| SOBO / South Bow Corporation | 0.06 | -77.16 | 1.50 | -77.76 | 0.4713 | 0.0676 | |||
| AGCO / AGCO Corporation | 0.02 | -72.87 | 1.47 | -72.59 | 0.4631 | 0.1413 | |||
| TMO / Thermo Fisher Scientific Inc. | 0.00 | -79.94 | 1.40 | -84.73 | 0.4394 | -0.1087 | |||
| BMY / Bristol-Myers Squibb Company | 0.03 | -78.40 | 1.32 | -82.51 | 0.4140 | -0.0369 | |||
| PSX / Phillips 66 | 0.01 | -61.13 | 1.29 | -65.99 | 0.4063 | 0.1787 | |||
| FERG / Ferguson Enterprises Inc. | 0.01 | -67.20 | 1.21 | -66.31 | 0.3817 | 0.1658 | |||
| SU / Suncor Energy Inc. | 0.03 | -82.06 | 1.17 | -83.34 | 0.3676 | -0.0527 | |||
| DG / Dollar General Corporation | 0.01 | -81.62 | 1.16 | -75.92 | 0.3646 | 0.0763 | |||
| MAT / Mattel, Inc. | 0.06 | -84.27 | 1.15 | -86.01 | 0.3619 | -0.1310 | |||
| CAG / Conagra Brands, Inc. | 0.05 | -84.94 | 1.14 | -86.51 | 0.3593 | -0.1479 | |||
| INTC / Intel Corporation | 0.06 | -76.41 | 1.10 | -80.57 | 0.3469 | 0.0069 | |||
| ALL / The Allstate Corporation | 0.01 | 1.10 | 0.3469 | 0.3469 | |||||
| WFG / West Fraser Timber Co. Ltd. | 0.01 | -76.72 | 1.10 | -78.47 | 0.3454 | 0.0400 | |||
| TJX / The TJX Companies, Inc. | 0.01 | -82.16 | 1.09 | -81.85 | 0.3414 | -0.0170 | |||
| HES / Hess Corporation | 0.01 | -33.11 | 1.07 | -40.68 | 0.3364 | 0.2284 | |||
| PG / The Procter & Gamble Company | 0.01 | 1.04 | 0.3277 | 0.3277 | |||||
| CRBG / Corebridge Financial, Inc. | 0.03 | 1.04 | 0.3259 | 0.3259 | |||||
| HD / The Home Depot, Inc. | 0.00 | -73.55 | 0.99 | -75.45 | 0.3124 | 0.0701 | |||
| AMD / Advanced Micro Devices, Inc. | 0.01 | -81.86 | 0.97 | -79.89 | 0.3050 | 0.0161 | |||
| MMM / 3M Company | 0.01 | -85.38 | 0.88 | -86.03 | 0.2778 | -0.1007 | |||
| EOG / EOG Resources, Inc. | 0.01 | -88.61 | 0.81 | -90.26 | 0.2552 | -0.2437 | |||
| VZ / Verizon Communications Inc. | 0.02 | -83.17 | 0.78 | -82.85 | 0.2446 | -0.0268 | |||
| APO / Apollo Global Management, Inc. | 0.01 | -83.91 | 0.72 | -85.91 | 0.2277 | -0.0802 | |||
| BIIB / Biogen Inc. | 0.01 | -82.96 | 0.71 | -84.27 | 0.2245 | -0.0472 | |||
| US65339F7134 / NEXTERA ENERGY INC 6.926% PC 09/01/2025 | 0.02 | -77.02 | 0.67 | -77.25 | 0.2099 | 0.0342 | |||
| PFE / Pfizer Inc. | 0.03 | -90.80 | 0.65 | -91.82 | 0.2044 | -0.2717 | |||
| ABBV / AbbVie Inc. | 0.00 | -82.07 | 0.63 | -84.04 | 0.1992 | -0.0385 | |||
| MS / Morgan Stanley | 0.00 | -83.81 | 0.59 | -84.44 | 0.1851 | -0.0414 | |||
| MRK / Merck & Co., Inc. | 0.01 | -80.02 | 0.59 | -83.35 | 0.1839 | -0.0266 | |||
| CRM / Salesforce, Inc. | 0.00 | -79.36 | 0.55 | -81.64 | 0.1725 | -0.0062 | |||
| US76105Y1091 / T. Rowe Price Government Reserve Fund | 0.52 | -95.07 | 0.52 | -95.08 | 0.1634 | -0.4680 | |||
| SUI / Sun Communities, Inc. | 0.00 | 0.47 | 0.1475 | 0.1475 | |||||
| XEL / Xcel Energy Inc. | 0.01 | -90.94 | 0.47 | -91.46 | 0.1474 | -0.1574 | |||
| CSCO / Cisco Systems, Inc. | 0.01 | -85.13 | 0.46 | -85.38 | 0.1434 | -0.0434 | |||
| 7839989D1 / SSC GOVERNMENT MM GVMXX GVMXX | 0.45 | -70.28 | 0.45 | -70.31 | 0.1401 | 0.0552 | |||
| CNC / Centene Corporation | 0.01 | -83.08 | 0.39 | -83.62 | 0.1238 | -0.0199 | |||
| T / AT&T Inc. | 0.01 | -83.86 | 0.36 | -83.64 | 0.1132 | -0.0185 | |||
| HUM / Humana Inc. | 0.00 | -83.08 | 0.36 | -85.41 | 0.1129 | -0.0345 | |||
| CAH / Cardinal Health, Inc. | 0.00 | -91.94 | 0.29 | -90.40 | 0.0907 | -0.0891 | |||
| GEHC / GE HealthCare Technologies Inc. | 0.00 | -86.12 | 0.28 | -88.82 | 0.0880 | -0.0616 | |||
| CVX / Chevron Corporation | 0.00 | -92.48 | 0.24 | -93.52 | 0.0758 | -0.1471 | |||
| SNY / Sanofi - Depositary Receipt (Common Stock) | 0.00 | -78.16 | 0.24 | -89.14 | 0.0744 | -0.6090 | |||
| KDP / Keurig Dr Pepper Inc. | 0.01 | -88.54 | 0.22 | -88.52 | 0.0690 | -0.0452 | |||
| P911 / Dr. Ing. h.c. F. Porsche AG - Preferred Stock | 0.00 | -89.66 | 0.17 | -91.52 | 0.0544 | -0.0677 | |||
| JH COLLATERAL / STIV (N/A) | 0.01 | 0.11 | 0.0344 | 0.0344 | |||||
| KSS / Kohl's Corporation | 0.01 | -90.12 | 0.11 | -93.01 | 0.0336 | -0.0573 | |||
| PCG / PG&E Corporation | 0.01 | -93.85 | 0.10 | -93.65 | 0.0312 | -0.0623 | |||
| NI / NiSource Inc. | 0.00 | -96.53 | 0.08 | -96.66 | 0.0246 | -0.1151 | |||
| GPN / Global Payments Inc. | 0.00 | 0.08 | 0.0238 | 0.0238 |