Basic Stats
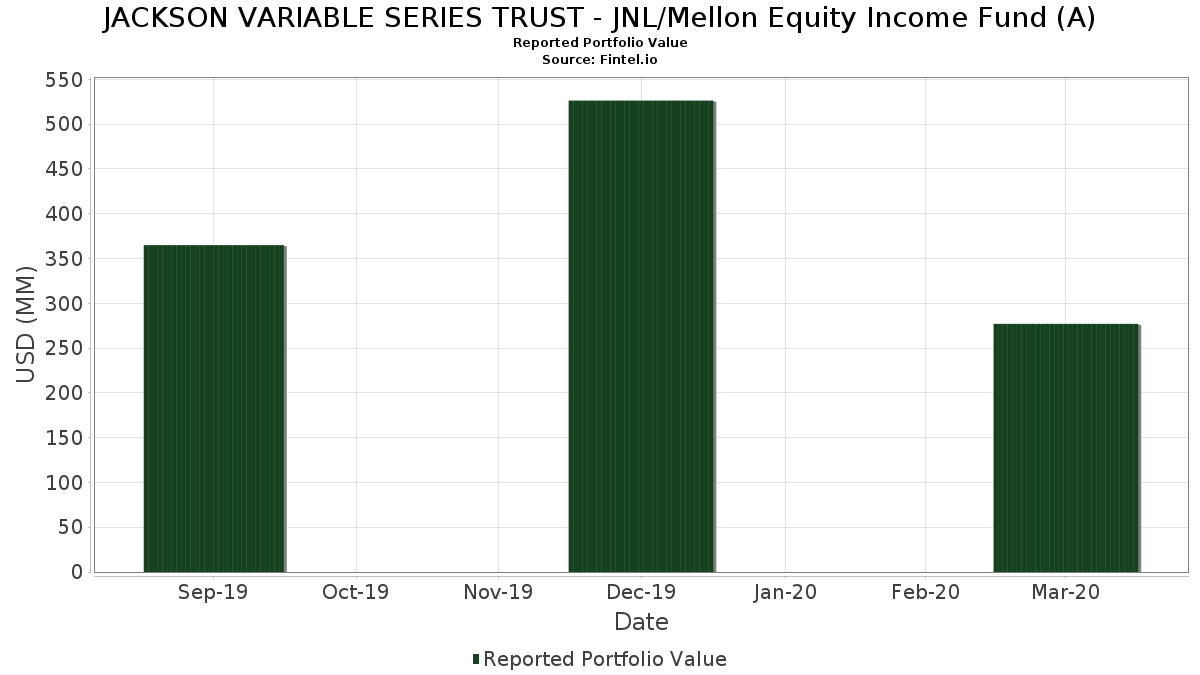
| Portfolio Value | $ 277,036,144 |
| Current Positions | 74 |
Latest Holdings, Performance, AUM (from 13F, 13D)
JACKSON VARIABLE SERIES TRUST - JNL/Mellon Equity Income Fund (A) has disclosed 74 total holdings in their latest SEC filings. Most recent portfolio value is calculated to be $ 277,036,144 USD. Actual Assets Under Management (AUM) is this value plus cash (which is not disclosed). JACKSON VARIABLE SERIES TRUST - JNL/Mellon Equity Income Fund (A)’s top holdings are Berkshire Hathaway Inc. (US:BRK.B) , JPMorgan Chase & Co. (US:JPM) , Medtronic plc (US:MDT) , CF Industries Holdings, Inc. (US:CF) , and The Goldman Sachs Group, Inc. (US:GS) . JACKSON VARIABLE SERIES TRUST - JNL/Mellon Equity Income Fund (A)’s new positions include Intel Corporation (US:INTC) , AbbVie Inc. (US:ABBV) , Eaton Corporation plc (US:ETN) , Bristol-Myers Squibb Company (US:BMY) , and Las Vegas Sands Corp. (US:LVS) .
Top Increases This Quarter
We use the change in the portfolio allocation because this is the most meaningful metric. Changes can be due to trades or changes in share prices.
| Security | Shares (MM) |
Value (MM$) |
Portfolio % | ΔPortfolio % |
|---|---|---|---|---|
| 0.11 | 6.20 | 2.2926 | 2.2926 | |
| 6.69 | 6.69 | 2.4739 | 1.8205 | |
| 0.05 | 3.95 | 1.4608 | 1.4608 | |
| 0.05 | 3.58 | 1.3239 | 1.3239 | |
| 0.05 | 2.96 | 1.0956 | 1.0956 | |
| 0.06 | 2.63 | 0.9732 | 0.9732 | |
| 0.00 | 2.55 | 0.9440 | 0.9440 | |
| 0.03 | 2.46 | 0.9107 | 0.9107 | |
| 0.03 | 2.41 | 0.8911 | 0.8911 | |
| 0.31 | 8.53 | 3.1546 | 0.8275 |
Top Decreases This Quarter
We use the change in the portfolio allocation because this is the most meaningful metric. Changes can be due to trades or changes in share prices.
| Security | Shares (MM) |
Value (MM$) |
Portfolio % | ΔPortfolio % |
|---|---|---|---|---|
| 0.12 | 3.41 | 1.2595 | -2.0200 | |
| 0.09 | 3.81 | 1.4070 | -1.6427 | |
| 0.00 | 0.00 | -1.5853 | ||
| 0.00 | 0.00 | -1.5075 | ||
| 0.00 | 0.00 | -1.2051 | ||
| 0.16 | 3.72 | 1.3744 | -1.0342 | |
| 0.28 | 5.88 | 2.1744 | -0.8829 | |
| 0.00 | 0.00 | -0.7453 | ||
| 0.00 | 0.00 | -0.7249 | ||
| 0.04 | 1.28 | 0.4740 | -0.6773 |
13F and Fund Filings
This form was filed on 2020-05-28 for the reporting period 2020-03-31. Click the link icon to see the full transaction history.
Upgrade to unlock premium data and export to Excel ![]() .
.
| Security | Type | Avg Share Price | Shares (MM) |
ΔShares (%) |
ΔShares (%) |
Value ($MM) |
Portfolio (%) |
ΔPortfolio (%) |
|
|---|---|---|---|---|---|---|---|---|---|
| BRK.B / Berkshire Hathaway Inc. | 0.07 | -33.55 | 12.97 | -46.36 | 4.7979 | 0.1908 | |||
| JPM / JPMorgan Chase & Co. | 0.13 | -23.33 | 12.00 | -50.48 | 4.4381 | -0.1783 | |||
| MDT / Medtronic plc | 0.10 | -6.15 | 9.18 | -22.08 | 3.3949 | 0.1364 | |||
| CF / CF Industries Holdings, Inc. | 0.31 | 22.55 | 8.53 | -30.18 | 3.1546 | 0.8275 | |||
| GS / The Goldman Sachs Group, Inc. | 0.05 | -3.28 | 8.39 | -34.97 | 3.1017 | 0.6449 | |||
| PPL / PPL Corporation | 0.34 | -13.95 | 8.32 | -40.81 | 3.0768 | 0.3994 | |||
| 46628D411 / JNL Securities Lending Collateral Fund | 6.69 | 183.17 | 6.69 | 183.23 | 2.4739 | 1.8205 | |||
| MS / Morgan Stanley | 0.19 | -5.41 | 6.62 | -37.09 | 2.4486 | 0.4438 | |||
| RTX / RTX Corporation | 0.07 | -25.03 | 6.50 | -52.78 | 2.4044 | -0.2182 | |||
| INTC / Intel Corporation | 0.11 | 6.20 | 2.2926 | 2.2926 | |||||
| BAC / Bank of America Corporation | 0.28 | -39.23 | 5.88 | -63.37 | 2.1744 | -0.8829 | |||
| BDX / Becton, Dickinson and Company | 0.03 | -12.14 | 5.83 | -25.76 | 2.1556 | 0.6599 | |||
| VOYA / Voya Financial, Inc. | 0.13 | -23.73 | 5.22 | -49.29 | 1.9319 | -0.0301 | |||
| VMC / Vulcan Materials Company | 0.05 | -32.94 | 5.06 | -49.67 | 1.8712 | -0.0438 | |||
| MLM / Martin Marietta Materials, Inc. | 0.03 | -32.15 | 4.94 | -54.09 | 1.8270 | -0.2226 | |||
| HES / Hess Corporation | 0.15 | 2.84 | 4.93 | -48.74 | 1.8245 | -0.0089 | |||
| 46628D437 / JNL Government Money Market Fund | 4.93 | -8.21 | 4.93 | -8.21 | 1.8224 | 0.7998 | |||
| CB / Chubb Limited | 0.04 | 89.10 | 4.70 | 30.83 | 1.7374 | 0.7442 | |||
| MRK / Merck & Co., Inc. | 0.06 | -46.07 | 4.46 | -54.39 | 1.6485 | -0.2127 | |||
| AIZ / Assurant, Inc. | 0.04 | -9.02 | 4.45 | -27.76 | 1.6455 | 0.4724 | |||
| LHX / L3Harris Technologies, Inc. | 0.02 | -26.94 | 4.26 | -33.49 | 1.5738 | 0.3549 | |||
| AMAT / Applied Materials, Inc. | 0.09 | -12.69 | 4.17 | -34.46 | 1.5431 | 0.3304 | |||
| ABBV / AbbVie Inc. | 0.05 | 3.95 | 1.4608 | 1.4608 | |||||
| WDC / Western Digital Corporation | 0.09 | 31.35 | 3.93 | -13.88 | 1.4546 | 0.5847 | |||
| C / Citigroup Inc. | 0.09 | -54.93 | 3.81 | -76.24 | 1.4070 | -1.6427 | |||
| MPC / Marathon Petroleum Corporation | 0.16 | -25.03 | 3.72 | -70.61 | 1.3744 | -1.0342 | |||
| ANTM / Anthem Inc | 0.02 | -26.77 | 3.71 | -44.96 | 1.3737 | 0.0883 | |||
| ETN / Eaton Corporation plc | 0.05 | 3.58 | 1.3239 | 1.3239 | |||||
| GLW / Corning Incorporated | 0.17 | -25.03 | 3.55 | -47.10 | 1.3121 | 0.0345 | |||
| GM / General Motors Company | 0.17 | -4.41 | 3.50 | -45.73 | 1.2935 | 0.0659 | |||
| CL / Colgate-Palmolive Company | 0.05 | -25.03 | 3.48 | -27.73 | 1.2857 | 0.3694 | |||
| USB / U.S. Bancorp | 0.10 | -34.43 | 3.45 | -61.91 | 1.2768 | -0.4494 | |||
| T / AT&T Inc. | 0.12 | -73.48 | 3.41 | -80.22 | 1.2595 | -2.0200 | |||
| ADM / Archer-Daniels-Midland Company | 0.10 | -26.80 | 3.39 | -44.44 | 1.2533 | 0.0915 | |||
| COP / ConocoPhillips | 0.11 | -12.22 | 3.36 | -58.43 | 1.2408 | -0.2964 | |||
| PSX / Phillips 66 | 0.06 | -27.09 | 3.26 | -64.89 | 1.2052 | -0.5629 | |||
| BMY / Bristol-Myers Squibb Company | 0.05 | 2.96 | 1.0956 | 1.0956 | |||||
| QCOM / QUALCOMM Incorporated | 0.04 | -56.60 | 2.91 | -66.73 | 1.0772 | -0.5900 | |||
| PWR / Quanta Services, Inc. | 0.09 | -32.10 | 2.89 | -47.07 | 1.0699 | 0.0287 | |||
| UNP / Union Pacific Corporation | 0.02 | 31.24 | 2.82 | 2.40 | 1.0429 | 0.5182 | |||
| LPLA / LPL Financial Holdings Inc. | 0.05 | 8.24 | 2.80 | -36.14 | 1.0338 | 0.2000 | |||
| FCX / Freeport-McMoRan Inc. | 0.41 | -6.16 | 2.76 | -51.73 | 1.0202 | -0.0682 | |||
| DAL / Delta Air Lines, Inc. | 0.09 | -7.86 | 2.70 | -55.04 | 0.9974 | -0.1454 | |||
| LEN / Lennar Corporation | 0.07 | -42.07 | 2.70 | -60.33 | 0.9966 | -0.2976 | |||
| AIG / American International Group, Inc. | 0.11 | -19.34 | 2.68 | -61.90 | 0.9912 | -0.3486 | |||
| LVS / Las Vegas Sands Corp. | 0.06 | 2.63 | 0.9732 | 0.9732 | |||||
| CVS / CVS Health Corporation | 0.04 | -25.03 | 2.63 | -40.14 | 0.9714 | 0.1357 | |||
| HUM / Humana Inc. | 0.01 | -25.03 | 2.62 | -35.77 | 0.9702 | 0.1922 | |||
| GOOGL / Alphabet Inc. | 0.00 | 2.55 | 0.9440 | 0.9440 | |||||
| CSCO / Cisco Systems, Inc. | 0.06 | -15.97 | 2.53 | -31.13 | 0.9362 | 0.2360 | |||
| SCHW / The Charles Schwab Corporation | 0.08 | 36.07 | 2.53 | -3.81 | 0.9338 | 0.4337 | |||
| LOW / Lowe's Companies, Inc. | 0.03 | 2.46 | 0.9107 | 0.9107 | |||||
| PM / Philip Morris International Inc. | 0.03 | 2.41 | 0.8911 | 0.8911 | |||||
| PEP / PepsiCo, Inc. | 0.02 | -47.56 | 2.37 | -53.92 | 0.8774 | -0.1032 | |||
| OMC / Omnicom Group Inc. | 0.04 | 34.67 | 2.32 | -8.74 | 0.8569 | 0.3732 | |||
| IBM / International Business Machines Corporation | 0.02 | 13.28 | 2.31 | -6.24 | 0.8550 | 0.3852 | |||
| WTW / Willis Towers Watson Public Limited Company | 0.01 | 8.79 | 2.29 | -4.22 | 0.8473 | 0.1855 | |||
| PXD / Pioneer Natural Resources Company | 0.03 | 4.96 | 2.18 | -51.36 | 0.8077 | -0.0476 | |||
| NEM / Newmont Corporation | 0.05 | -63.30 | 2.07 | -61.77 | 0.7658 | -0.2655 | |||
| AAPL / Apple Inc. | 0.01 | -25.02 | 2.01 | -35.08 | 0.7427 | 0.1535 | |||
| STT / State Street Corporation | 0.04 | 1.89 | 0.7003 | 0.7003 | |||||
| LLY / Eli Lilly and Company | 0.01 | 1.84 | 0.6786 | 0.6786 | |||||
| LPX / Louisiana-Pacific Corporation | 0.11 | 9.94 | 1.83 | -36.34 | 0.6758 | 0.1290 | |||
| TT / Trane Technologies plc | 0.02 | 1.80 | 0.6652 | 0.6652 | |||||
| MCHP / Microchip Technology Incorporated | 0.03 | -39.55 | 1.79 | -60.86 | 0.6628 | -0.2095 | |||
| OUT / OUTFRONT Media Inc. | 0.12 | -8.88 | 1.63 | -54.21 | 0.6029 | -0.0752 | |||
| CWEN / Clearway Energy, Inc. | 0.08 | -38.47 | 1.55 | -42.04 | 0.5724 | 0.0639 | |||
| AVGO / Broadcom Inc. | 0.01 | -55.25 | 1.48 | -66.45 | 0.5465 | -0.2920 | |||
| NOC / Northrop Grumman Corporation | 0.00 | -25.04 | 1.41 | -34.08 | 0.5209 | 0.1140 | |||
| MOS / The Mosaic Company | 0.13 | -35.76 | 1.40 | -67.89 | 0.5183 | -0.3128 | |||
| COF / Capital One Financial Corporation | 0.03 | -26.93 | 1.39 | -64.20 | 0.5148 | -0.2258 | |||
| CAG / Conagra Brands, Inc. | 0.04 | -75.25 | 1.28 | -78.81 | 0.4740 | -0.6773 | |||
| DOW / Dow Inc. | 0.04 | -1.77 | 1.16 | -55.27 | 0.4272 | -0.0646 | |||
| WY / Weyerhaeuser Company | 0.07 | 1.13 | 0.4162 | 0.4162 | |||||
| SLB / Schlumberger Limited | 0.00 | -100.00 | 0.00 | -100.00 | -0.6644 | ||||
| EIX / Edison International | 0.00 | -100.00 | 0.00 | -100.00 | -1.5075 | ||||
| HON / Honeywell International Inc. | 0.00 | -100.00 | 0.00 | -100.00 | -0.6032 | ||||
| TGT / Target Corporation | 0.00 | -100.00 | 0.00 | -100.00 | -0.7453 | ||||
| US2692464017 / E*TRADE Financial, Inc. | 0.00 | -100.00 | 0.00 | -100.00 | -1.2051 | ||||
| RJF / Raymond James Financial, Inc. | 0.00 | -100.00 | 0.00 | -100.00 | -0.4401 | ||||
| PFE / Pfizer Inc. | 0.00 | -100.00 | 0.00 | -100.00 | -1.5853 | ||||
| TXN / Texas Instruments Incorporated | 0.00 | -100.00 | 0.00 | -100.00 | -0.4581 | ||||
| CMCSA / Comcast Corporation | 0.00 | -100.00 | 0.00 | -100.00 | -0.7249 | ||||
| HIG / The Hartford Insurance Group, Inc. | 0.00 | -100.00 | 0.00 | -100.00 | -0.5026 | ||||
| VLO / Valero Energy Corporation | 0.00 | -100.00 | 0.00 | -100.00 | -0.4922 |