Basic Stats
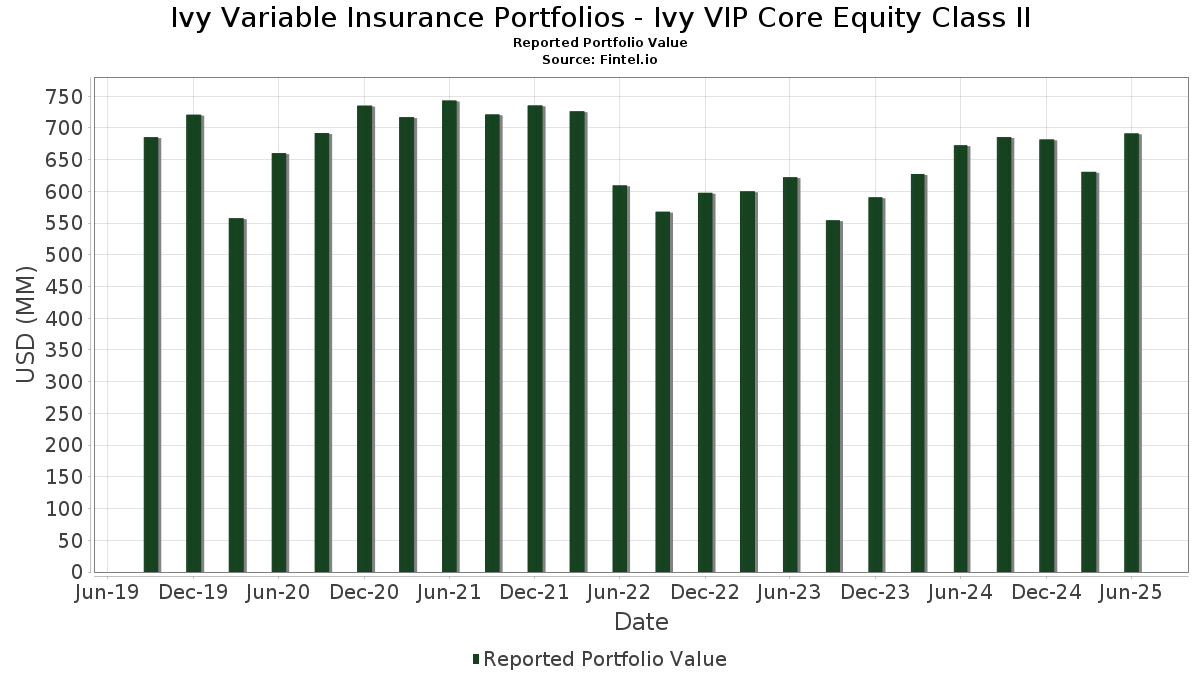
| Portfolio Value | $ 691,363,779 |
| Current Positions | 55 |
Latest Holdings, Performance, AUM (from 13F, 13D)
Ivy Variable Insurance Portfolios - Ivy VIP Core Equity Class II has disclosed 55 total holdings in their latest SEC filings. Most recent portfolio value is calculated to be $ 691,363,779 USD. Actual Assets Under Management (AUM) is this value plus cash (which is not disclosed). Ivy Variable Insurance Portfolios - Ivy VIP Core Equity Class II’s top holdings are Microsoft Corporation (US:MSFT) , NVIDIA Corporation (US:NVDA) , Amazon.com, Inc. (US:AMZN) , Howmet Aerospace Inc. (US:HWM) , and Taiwan Semiconductor Manufacturing Company Limited - Depositary Receipt (Common Stock) (US:TSM) . Ivy Variable Insurance Portfolios - Ivy VIP Core Equity Class II’s new positions include Advanced Micro Devices, Inc. (US:AMD) , Vulcan Materials Company (US:VMC) , .
Top Increases This Quarter
We use the change in the portfolio allocation because this is the most meaningful metric. Changes can be due to trades or changes in share prices.
| Security | Shares (MM) |
Value (MM$) |
Portfolio % | ΔPortfolio % |
|---|---|---|---|---|
| 0.24 | 38.28 | 5.5395 | 1.6773 | |
| 0.06 | 15.36 | 2.2234 | 1.3150 | |
| 0.10 | 50.25 | 7.2721 | 1.3073 | |
| 0.01 | 8.47 | 1.2259 | 1.2259 | |
| 0.05 | 6.57 | 0.9507 | 0.9507 | |
| 0.13 | 25.12 | 3.6348 | 0.7909 | |
| 0.10 | 23.57 | 3.4113 | 0.7426 | |
| 0.02 | 4.56 | 0.6598 | 0.6598 | |
| 0.14 | 31.70 | 4.5874 | 0.5558 | |
| 0.12 | 12.48 | 1.8057 | 0.5351 |
Top Decreases This Quarter
We use the change in the portfolio allocation because this is the most meaningful metric. Changes can be due to trades or changes in share prices.
| Security | Shares (MM) |
Value (MM$) |
Portfolio % | ΔPortfolio % |
|---|---|---|---|---|
| 0.10 | 21.19 | 3.0667 | -1.3568 | |
| 0.01 | 4.21 | 0.6093 | -1.2745 | |
| 0.09 | 15.11 | 2.1868 | -0.9575 | |
| 3.78 | 3.78 | 0.5473 | -0.6741 | |
| 3.78 | 3.78 | 0.5473 | -0.6741 | |
| 3.78 | 3.78 | 0.5473 | -0.6741 | |
| 3.78 | 3.78 | 0.5473 | -0.6741 | |
| 0.09 | 5.97 | 0.8637 | -0.5088 | |
| 0.01 | 5.97 | 0.8645 | -0.4934 | |
| 0.13 | 23.43 | 3.3902 | -0.4727 |
13F and Fund Filings
This form was filed on 2025-08-26 for the reporting period 2025-06-30. Click the link icon to see the full transaction history.
Upgrade to unlock premium data and export to Excel ![]() .
.
| Security | Type | Avg Share Price | Shares (MM) |
ΔShares (%) |
ΔShares (%) |
Value ($MM) |
Portfolio (%) |
ΔPortfolio (%) |
|
|---|---|---|---|---|---|---|---|---|---|
| MSFT / Microsoft Corporation | 0.10 | 0.84 | 50.25 | 33.62 | 7.2721 | 1.3073 | |||
| NVDA / NVIDIA Corporation | 0.24 | 7.84 | 38.28 | 57.20 | 5.5395 | 1.6773 | |||
| AMZN / Amazon.com, Inc. | 0.14 | 8.15 | 31.70 | 24.71 | 4.5874 | 0.5558 | |||
| HWM / Howmet Aerospace Inc. | 0.13 | -2.37 | 25.12 | 40.08 | 3.6348 | 0.7909 | |||
| TSM / Taiwan Semiconductor Manufacturing Company Limited - Depositary Receipt (Common Stock) | 0.10 | 2.68 | 23.57 | 40.10 | 3.4113 | 0.7426 | |||
| GOOGL / Alphabet Inc. | 0.13 | -15.59 | 23.43 | -3.81 | 3.3902 | -0.4727 | |||
| AAPL / Apple Inc. | 0.10 | -17.73 | 21.19 | -24.02 | 3.0667 | -1.3568 | |||
| META / Meta Platforms, Inc. | 0.03 | -2.37 | 20.01 | 25.03 | 2.8957 | 0.3573 | |||
| COST / Costco Wholesale Corporation | 0.02 | -2.37 | 18.33 | 2.19 | 2.6530 | -0.1924 | |||
| ABT / Abbott Laboratories | 0.12 | 4.58 | 16.58 | 7.23 | 2.3998 | -0.0530 | |||
| CME / CME Group Inc. | 0.06 | 1.45 | 16.21 | 5.40 | 2.3465 | -0.0935 | |||
| T / AT&T Inc. | 0.56 | -2.37 | 16.19 | -0.09 | 2.3431 | -0.2272 | |||
| AVGO / Broadcom Inc. | 0.06 | 62.93 | 15.36 | 168.27 | 2.2234 | 1.3150 | |||
| FI / Fiserv, Inc. | 0.09 | -2.37 | 15.11 | -23.77 | 2.1868 | -0.9575 | |||
| AZO / AutoZone, Inc. | 0.00 | -2.41 | 15.02 | -4.98 | 2.1741 | -0.3338 | |||
| COF / Capital One Financial Corporation | 0.07 | -21.26 | 14.87 | -6.57 | 2.1522 | -0.3724 | |||
| EADSY / Airbus SE - Depositary Receipt (Common Stock) | 0.27 | -2.37 | 14.06 | 15.94 | 2.0344 | 0.1113 | |||
| JPM / JPMorgan Chase & Co. | 0.05 | 24.27 | 13.46 | 46.87 | 1.9485 | 0.4944 | |||
| ETN / Eaton Corporation plc | 0.04 | -2.36 | 13.17 | 28.23 | 1.9063 | 0.2769 | |||
| AXP / American Express Company | 0.04 | -2.36 | 12.87 | 15.76 | 1.8624 | 0.0990 | |||
| BAESY / BAE Systems plc - Depositary Receipt (Common Stock) | 0.12 | 21.90 | 12.48 | 55.77 | 1.8057 | 0.5351 | |||
| CRM / Salesforce, Inc. | 0.05 | 18.28 | 12.45 | 20.19 | 1.8022 | 0.1587 | |||
| PGR / The Progressive Corporation | 0.05 | -2.36 | 12.37 | -7.94 | 1.7906 | -0.3411 | |||
| AMAT / Applied Materials, Inc. | 0.07 | -2.37 | 12.36 | 23.17 | 1.7893 | 0.1970 | |||
| MA / Mastercard Incorporated | 0.02 | 8.74 | 12.27 | 11.48 | 1.7750 | 0.0299 | |||
| ALL / The Allstate Corporation | 0.06 | -2.37 | 11.85 | -5.09 | 1.7147 | -0.2653 | |||
| HD / The Home Depot, Inc. | 0.03 | -2.37 | 11.82 | -2.33 | 1.7109 | -0.2090 | |||
| LIN / Linde plc | 0.02 | -2.37 | 11.23 | -1.62 | 1.6255 | -0.1855 | |||
| SAP / SAP SE - Depositary Receipt (Common Stock) | 0.04 | 32.77 | 10.67 | 50.39 | 1.5437 | 0.4188 | |||
| KKR / KKR & Co. Inc. | 0.08 | 7.63 | 10.53 | 23.85 | 1.5240 | 0.1753 | |||
| MS / Morgan Stanley | 0.07 | -2.37 | 10.28 | 17.88 | 1.4881 | 0.1045 | |||
| BX / Blackstone Inc. | 0.06 | -2.37 | 8.72 | 4.48 | 1.2616 | -0.0618 | |||
| CCK / Crown Holdings, Inc. | 0.08 | 11.83 | 8.63 | 29.02 | 1.2488 | 0.1879 | |||
| ZBRA / Zebra Technologies Corporation | 0.03 | 24.30 | 8.56 | 35.65 | 1.2389 | 0.2379 | |||
| NFLX / Netflix, Inc. | 0.01 | 8.47 | 1.2259 | 1.2259 | |||||
| ALLY / Ally Financial Inc. | 0.22 | -2.36 | 8.38 | 4.28 | 1.2132 | -0.0620 | |||
| HCA / HCA Healthcare, Inc. | 0.02 | -2.37 | 8.28 | 8.24 | 1.1978 | -0.0151 | |||
| SHW / The Sherwin-Williams Company | 0.02 | -2.37 | 8.07 | -4.00 | 1.1683 | -0.1655 | |||
| CMI / Cummins Inc. | 0.02 | 41.02 | 7.91 | 47.34 | 1.1440 | 0.2931 | |||
| AON / Aon plc | 0.02 | -2.36 | 7.77 | -12.71 | 1.1250 | -0.2877 | |||
| VRTX / Vertex Pharmaceuticals Incorporated | 0.02 | -2.37 | 6.89 | -10.34 | 0.9967 | -0.2218 | |||
| AMD / Advanced Micro Devices, Inc. | 0.05 | 6.57 | 0.9507 | 0.9507 | |||||
| STX / Seagate Technology Holdings plc | 0.04 | -41.21 | 6.08 | -0.12 | 0.8797 | -0.0855 | |||
| LMT / Lockheed Martin Corporation | 0.01 | -32.70 | 5.97 | -30.23 | 0.8645 | -0.4934 | |||
| NEE / NextEra Energy, Inc. | 0.09 | -29.57 | 5.97 | -31.03 | 0.8637 | -0.5088 | |||
| LYV / Live Nation Entertainment, Inc. | 0.04 | -19.29 | 5.76 | -6.49 | 0.8342 | -0.1436 | |||
| DHR / Danaher Corporation | 0.03 | -2.37 | 5.24 | -5.92 | 0.7587 | -0.1252 | |||
| VMC / Vulcan Materials Company | 0.02 | 4.56 | 0.6598 | 0.6598 | |||||
| UNH / UnitedHealth Group Incorporated | 0.01 | -40.48 | 4.21 | -64.55 | 0.6093 | -1.2745 | |||
| TE Connectivity PLC / EC (IE000IVNQZ81) | 0.02 | -49.99 | 3.84 | -40.31 | 0.5556 | -0.4646 | |||
| GSAXX / Goldman Sachs Trust - Goldman Sachs Financial Square Government Fund | 3.78 | -50.89 | 3.78 | -50.90 | 0.5473 | -0.6741 | |||
| TFDXX / Blackrock Liquidity Funds - BlackRock Liquidity Funds FedFund Portfolio Institutional Class | 3.78 | -50.89 | 3.78 | -50.90 | 0.5473 | -0.6741 | |||
| US61747C7074 / Morgan Stanley Institutional Liquidity Funds Government Portfolio, Institutional Class | 3.78 | -50.89 | 3.78 | -50.90 | 0.5473 | -0.6741 | |||
| FIGXX / Fidelity Colchester Street Trust - Fidelity Institutional Money Market Funds Government Portfolio Class I | 3.78 | -50.89 | 3.78 | -50.90 | 0.5473 | -0.6741 | |||
| COP / ConocoPhillips | 0.04 | -2.36 | 3.22 | -16.59 | 0.4665 | -0.1464 |