Basic Stats
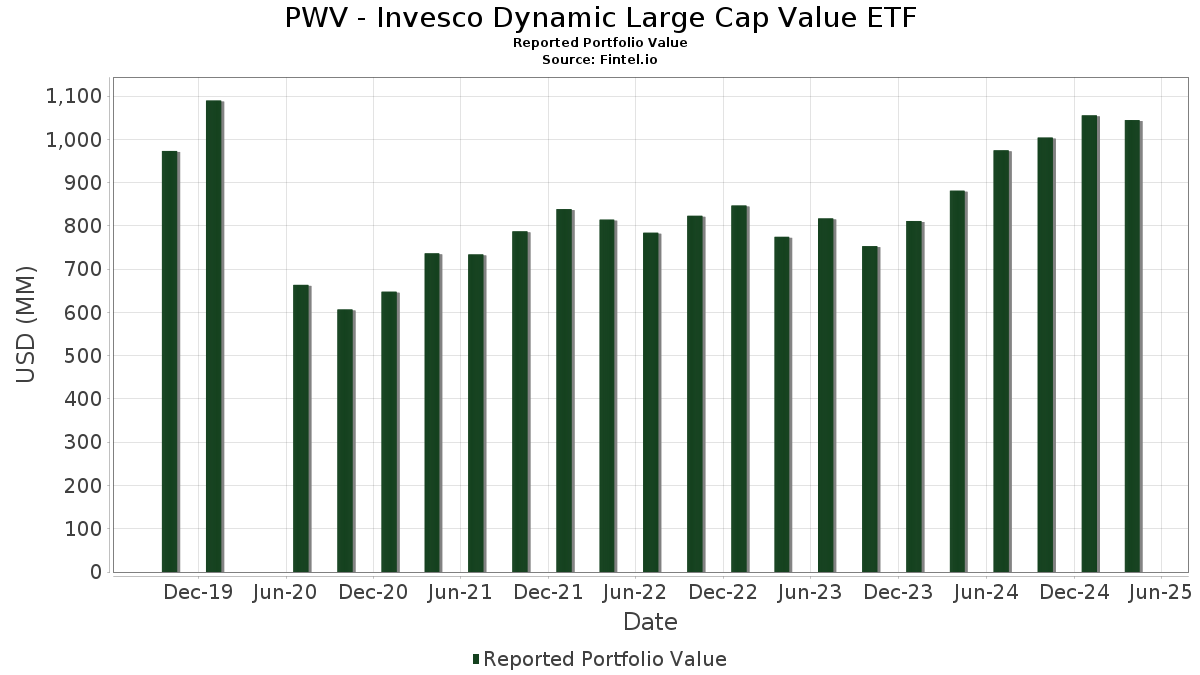
| Portfolio Value | $ 1,044,469,285 |
| Current Positions | 53 |
Latest Holdings, Performance, AUM (from 13F, 13D)
PWV - Invesco Dynamic Large Cap Value ETF has disclosed 53 total holdings in their latest SEC filings. Most recent portfolio value is calculated to be $ 1,044,469,285 USD. Actual Assets Under Management (AUM) is this value plus cash (which is not disclosed). PWV - Invesco Dynamic Large Cap Value ETF’s top holdings are Philip Morris International Inc. (US:PM) , Exxon Mobil Corporation (US:XOM) , AbbVie Inc. (US:ABBV) , JPMorgan Chase & Co. (US:JPM) , and The Procter & Gamble Company (US:PG) . PWV - Invesco Dynamic Large Cap Value ETF’s new positions include Charter Communications, Inc. (US:CHTR) , PayPal Holdings, Inc. (US:PYPL) , CBRE Group, Inc. (US:CBRE) , .
Top Increases This Quarter
We use the change in the portfolio allocation because this is the most meaningful metric. Changes can be due to trades or changes in share prices.
| Security | Shares (MM) |
Value (MM$) |
Portfolio % | ΔPortfolio % |
|---|---|---|---|---|
| 0.22 | 32.57 | 3.2546 | 3.2546 | |
| 32.18 | 32.18 | 3.2156 | 3.2156 | |
| 0.06 | 31.45 | 3.1429 | 1.8446 | |
| 0.04 | 16.53 | 1.6522 | 1.6522 | |
| 0.24 | 15.86 | 1.5851 | 1.5851 | |
| 0.27 | 31.46 | 3.1433 | 1.5344 | |
| 0.10 | 14.35 | 1.4339 | 1.4339 | |
| 0.17 | 14.18 | 1.4170 | 1.4170 | |
| 0.20 | 13.46 | 1.3446 | 1.3446 | |
| 0.11 | 13.33 | 1.3324 | 1.3324 |
Top Decreases This Quarter
We use the change in the portfolio allocation because this is the most meaningful metric. Changes can be due to trades or changes in share prices.
| Security | Shares (MM) |
Value (MM$) |
Portfolio % | ΔPortfolio % |
|---|---|---|---|---|
| 0.00 | 0.00 | -1.3237 | ||
| 0.14 | 33.18 | 3.3155 | -0.5806 | |
| 0.55 | 31.73 | 3.1703 | -0.3844 | |
| 0.14 | 33.61 | 3.3582 | -0.3219 | |
| 0.80 | 13.23 | 1.3223 | -0.2744 | |
| 0.47 | 33.04 | 3.3014 | -0.2298 | |
| 0.17 | 33.80 | 3.3774 | -0.2011 | |
| 0.34 | 12.85 | 1.2845 | -0.1781 | |
| 0.04 | 12.32 | 1.2311 | -0.1704 | |
| 0.08 | 14.07 | 1.4062 | -0.1641 |
13F and Fund Filings
This form was filed on 2025-06-27 for the reporting period 2025-04-30. Click the link icon to see the full transaction history.
Upgrade to unlock premium data and export to Excel ![]() .
.
| Security | Type | Avg Share Price | Shares (MM) |
ΔShares (%) |
ΔShares (%) |
Value ($MM) |
Portfolio (%) |
ΔPortfolio (%) |
|
|---|---|---|---|---|---|---|---|---|---|
| PM / Philip Morris International Inc. | 0.22 | -15.08 | 38.50 | 45.56 | 3.8469 | 0.4331 | |||
| XOM / Exxon Mobil Corporation | 0.32 | 10.18 | 34.04 | 8.94 | 3.4020 | 0.3332 | |||
| ABBV / AbbVie Inc. | 0.17 | -12.57 | 33.80 | -7.25 | 3.3774 | -0.2011 | |||
| JPM / JPMorgan Chase & Co. | 0.14 | -2.01 | 33.61 | -10.32 | 3.3582 | -0.3219 | |||
| PG / The Procter & Gamble Company | 0.20 | 3.55 | 33.30 | 1.41 | 3.3278 | 0.1031 | |||
| JNJ / Johnson & Johnson | 0.21 | -5.48 | 33.28 | -2.89 | 3.3260 | -0.0399 | |||
| IBM / International Business Machines Corporation | 0.14 | -11.57 | 33.18 | -16.37 | 3.3155 | -0.5806 | |||
| WFC / Wells Fargo & Company | 0.47 | 1.96 | 33.04 | -8.12 | 3.3014 | -0.2298 | |||
| QCOM / QUALCOMM Incorporated | 0.22 | 32.57 | 3.2546 | 3.2546 | |||||
| HD / The Home Depot, Inc. | 0.09 | 9.83 | 32.41 | -3.90 | 3.2391 | -0.0732 | |||
| Invesco Private Prime Fund / STIV (N/A) | 32.18 | 32.18 | 3.2156 | 3.2156 | |||||
| BAC / Bank of America Corporation | 0.80 | 8.93 | 32.09 | -6.17 | 3.2069 | -0.1520 | |||
| CSCO / Cisco Systems, Inc. | 0.55 | -8.00 | 31.73 | -12.35 | 3.1703 | -0.3844 | |||
| MS / Morgan Stanley | 0.27 | 99.86 | 31.46 | 98.44 | 3.1433 | 1.5344 | |||
| GS / The Goldman Sachs Group, Inc. | 0.06 | 68.51 | 31.45 | 202.05 | 3.1429 | 1.8446 | |||
| CVX / Chevron Corporation | 0.23 | 3.33 | 30.77 | -5.76 | 3.0743 | -0.1317 | |||
| COR / Cencora, Inc. | 0.06 | -2.03 | 17.68 | 12.79 | 1.7672 | 0.2275 | |||
| CME / CME Group Inc. | 0.06 | -4.48 | 16.72 | 36.64 | 1.6711 | 0.4093 | |||
| KR / The Kroger Co. | 0.23 | -7.78 | 16.70 | 8.04 | 1.6683 | 0.1508 | |||
| CHTR / Charter Communications, Inc. | 0.04 | 16.53 | 1.6522 | 1.6522 | |||||
| LNG / Cheniere Energy, Inc. | 0.07 | 1.51 | 16.19 | 4.90 | 1.6181 | 0.1022 | |||
| MO / Altria Group, Inc. | 0.27 | 1.96 | 15.99 | 15.47 | 1.5977 | 0.2379 | |||
| CVS / CVS Health Corporation | 0.24 | 15.86 | 1.5851 | 1.5851 | |||||
| WMB / The Williams Companies, Inc. | 0.27 | 4.22 | 15.78 | 10.12 | 1.5770 | 0.1696 | |||
| T / AT&T Inc. | 0.57 | -12.89 | 15.73 | 1.68 | 1.5722 | 0.0527 | |||
| HCA / HCA Healthcare, Inc. | 0.05 | 9.91 | 15.68 | 4.47 | 1.5671 | 0.0195 | |||
| AFL / Aflac Incorporated | 0.14 | 6.72 | 15.41 | 8.01 | 1.5402 | 0.1388 | |||
| KMI / Kinder Morgan, Inc. | 0.58 | 7.22 | 15.25 | 2.62 | 1.5242 | 0.0646 | |||
| JCI / Johnson Controls International plc | 0.18 | -0.07 | 15.14 | 7.49 | 1.5126 | 0.1297 | |||
| GM / General Motors Company | 0.32 | 29.99 | 14.66 | 18.90 | 1.4650 | 0.2541 | |||
| GILD / Gilead Sciences, Inc. | 0.14 | -18.46 | 14.46 | -10.62 | 1.4450 | -0.1439 | |||
| MMM / 3M Company | 0.10 | 14.35 | 1.4339 | 1.4339 | |||||
| MDT / Medtronic plc | 0.17 | 14.18 | 1.4170 | 1.4170 | |||||
| COF / Capital One Financial Corporation | 0.08 | -0.55 | 14.07 | -11.99 | 1.4062 | -0.1641 | |||
| BK / The Bank of New York Mellon Corporation | 0.17 | -5.91 | 14.03 | -11.95 | 1.4021 | -0.1629 | |||
| PRU / Prudential Financial, Inc. | 0.14 | 16.56 | 13.99 | -0.86 | 1.3984 | 0.0122 | |||
| LOW / Lowe's Companies, Inc. | 0.06 | 14.28 | 13.96 | -1.75 | 1.3952 | -0.0004 | |||
| MET / MetLife, Inc. | 0.18 | 6.76 | 13.88 | -6.99 | 1.3869 | -0.0785 | |||
| MPC / Marathon Petroleum Corporation | 0.10 | 4.56 | 13.81 | -1.40 | 1.3802 | 0.0046 | |||
| PYPL / PayPal Holdings, Inc. | 0.20 | 13.46 | 1.3446 | 1.3446 | |||||
| CBRE / CBRE Group, Inc. | 0.11 | 13.33 | 1.3324 | 1.3324 | |||||
| USB / U.S. Bancorp | 0.33 | 66.30 | 13.30 | 15.29 | 1.3291 | -0.0506 | |||
| C / Citigroup Inc. | 0.19 | 13.25 | 1.3237 | 1.3237 | |||||
| ET / Energy Transfer LP - Limited Partnership | 0.80 | 0.77 | 13.23 | -18.62 | 1.3223 | -0.2744 | |||
| VLO / Valero Energy Corporation | 0.11 | 5.13 | 13.15 | -8.24 | 1.3138 | -0.0932 | |||
| PNC / The PNC Financial Services Group, Inc. | 0.08 | 14.64 | 13.04 | -8.33 | 1.3034 | -0.0938 | |||
| OKE / ONEOK, Inc. | 0.16 | 17.15 | 12.99 | -0.95 | 1.2976 | 0.0102 | |||
| TFC / Truist Financial Corporation | 0.34 | 7.20 | 12.85 | -13.69 | 1.2845 | -0.1781 | |||
| EOG / EOG Resources, Inc. | 0.12 | 0.99 | 12.72 | -11.42 | 1.2709 | -0.1390 | |||
| Invesco Private Government Fund / STIV (N/A) | 12.35 | 12.35 | 1.2338 | 1.2338 | |||||
| CMI / Cummins Inc. | 0.04 | 4.66 | 12.32 | -13.68 | 1.2311 | -0.1704 | |||
| DAL / Delta Air Lines, Inc. | 0.24 | 10.20 | 1.0191 | 1.0191 | |||||
| US8252528851 / Invesco Government & Agency Portfolio, Institutional Class | 0.79 | 182.73 | 0.79 | 183.39 | 0.0785 | 0.0503 | |||
| PEG / Public Service Enterprise Group Incorporated | 0.00 | -100.00 | 0.00 | -100.00 | -1.3237 |