Basic Stats
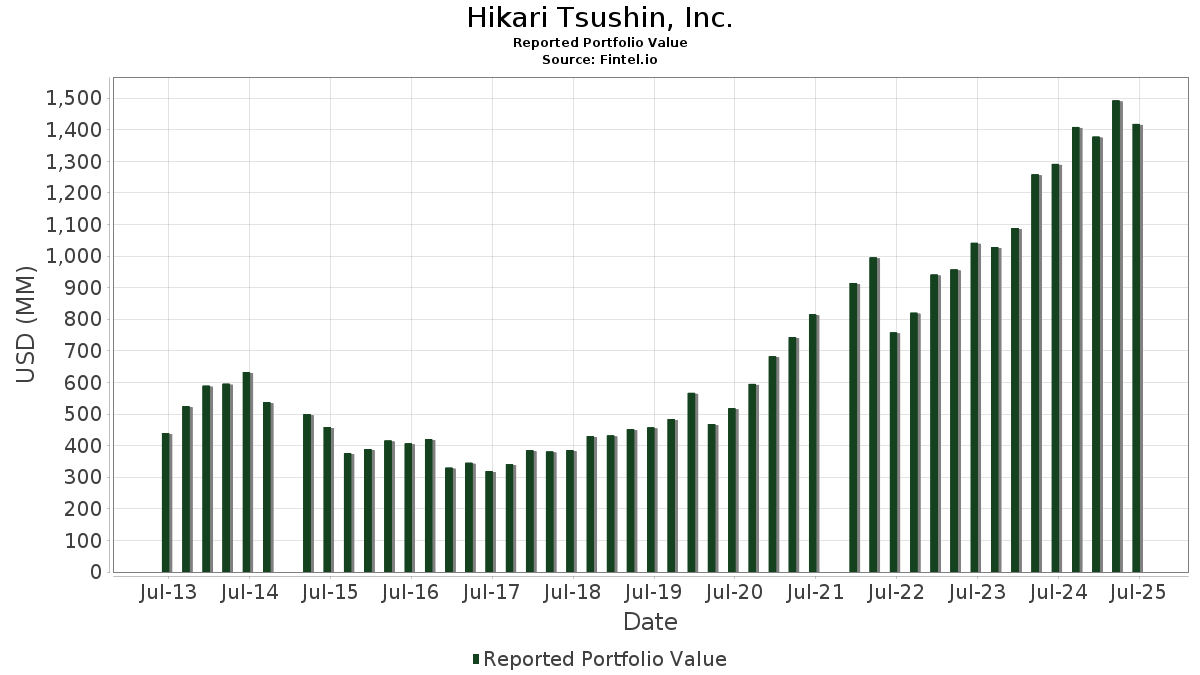
| Portfolio Value | $ 1,417,933,621 |
| Current Positions | 76 |
Latest Holdings, Performance, AUM (from 13F, 13D)
Hikari Tsushin, Inc. has disclosed 76 total holdings in their latest SEC filings. Most recent portfolio value is calculated to be $ 1,417,933,621 USD. Actual Assets Under Management (AUM) is this value plus cash (which is not disclosed). Hikari Tsushin, Inc.’s top holdings are Berkshire Hathaway Inc. (US:BRK.A) , Alphabet Inc. (US:GOOGL) , Invesco Exchange-Traded Fund Trust II - Invesco Senior Loan ETF (US:BKLN) , Vanguard Index Funds - Vanguard S&P 500 ETF (US:VOO) , and Visa Inc. (US:V) . Hikari Tsushin, Inc.’s new positions include Zoetis Inc. (US:ZTS) , Ralliant Corporation (US:RAL) , abrdn Platinum ETF Trust - abrdn Physical Platinum Shares ETF (US:PPLT) , Vanguard Specialized Funds - Vanguard Dividend Appreciation ETF (US:VIG) , and Global X Funds - Global X Uranium ETF (US:URA) .
Top Increases This Quarter
We use the change in the portfolio allocation because this is the most meaningful metric. Changes can be due to trades or changes in share prices.
| Security | Shares (MM) |
Value (MM$) |
Portfolio % | ΔPortfolio % |
|---|---|---|---|---|
| 0.59 | 104.27 | 7.3539 | 1.2031 | |
| 2.48 | 51.96 | 3.6646 | 0.2184 | |
| 0.10 | 36.06 | 2.5429 | 0.1806 | |
| 0.34 | 27.68 | 1.9519 | 0.1373 | |
| 0.03 | 15.89 | 1.1210 | 0.1319 | |
| 0.07 | 41.82 | 2.9493 | 0.1040 | |
| 0.01 | 5.11 | 0.3607 | 0.1020 | |
| 0.57 | 26.17 | 1.8454 | 0.1007 | |
| 0.02 | 9.54 | 0.6725 | 0.0900 | |
| 0.01 | 1.18 | 0.0830 | 0.0830 |
Top Decreases This Quarter
We use the change in the portfolio allocation because this is the most meaningful metric. Changes can be due to trades or changes in share prices.
| Security | Shares (MM) |
Value (MM$) |
Portfolio % | ΔPortfolio % |
|---|---|---|---|---|
| 0.00 | 821.36 | 57.9264 | -2.3870 | |
| 0.16 | 9.28 | 0.6548 | -0.4634 | |
| 0.16 | 24.68 | 1.7403 | -0.1353 | |
| 0.10 | 19.48 | 1.3741 | -0.1000 | |
| 0.06 | 3.30 | 0.2324 | -0.0777 | |
| 0.08 | 3.76 | 0.2649 | -0.0668 | |
| 0.14 | 20.91 | 1.4750 | -0.0470 | |
| 0.05 | 5.60 | 0.3952 | -0.0192 | |
| 0.03 | 4.58 | 0.3227 | -0.0054 | |
| 0.02 | 4.72 | 0.3331 | -0.0044 |
13F and Fund Filings
This form was filed on 2025-08-12 for the reporting period 2025-06-30. Click the link icon to see the full transaction history.
Upgrade to unlock premium data and export to Excel ![]() .
.
| Security | Type | Avg Share Price | Shares (MM) |
ΔShares (%) |
ΔShares (%) |
Value ($MM) |
Portfolio (%) |
ΔPortfolio (%) |
|
|---|---|---|---|---|---|---|---|---|---|
| BRK.A / Berkshire Hathaway Inc. | 0.00 | 0.00 | 821.36 | -8.72 | 57.9264 | -2.3870 | |||
| GOOGL / Alphabet Inc. | 0.59 | -0.29 | 104.27 | 13.63 | 7.3539 | 1.2031 | |||
| BKLN / Invesco Exchange-Traded Fund Trust II - Invesco Senior Loan ETF | 2.48 | 0.00 | 51.96 | 1.06 | 3.6646 | 0.2184 | |||
| VOO / Vanguard Index Funds - Vanguard S&P 500 ETF | 0.07 | -10.87 | 41.82 | -1.49 | 2.9493 | 0.1040 | |||
| V / Visa Inc. | 0.10 | 0.98 | 36.06 | 2.31 | 2.5429 | 0.1806 | |||
| HYG / iShares Trust - iShares iBoxx $ High Yield Corporate Bond ETF | 0.34 | 0.00 | 27.68 | 2.23 | 1.9519 | 0.1373 | |||
| FTSL / First Trust Exchange-Traded Fund IV - First Trust Senior Loan Fund | 0.57 | 0.00 | 26.17 | 0.53 | 1.8454 | 0.1007 | |||
| MMM / 3M Company | 0.16 | -14.93 | 24.68 | -11.82 | 1.7403 | -0.1353 | |||
| JNJ / Johnson & Johnson | 0.14 | 0.00 | 20.91 | -7.89 | 1.4750 | -0.0470 | |||
| ABBV / AbbVie Inc. | 0.10 | 0.00 | 19.48 | -11.40 | 1.3741 | -0.1000 | |||
| MCO / Moody's Corporation | 0.03 | 0.00 | 15.89 | 7.70 | 1.1210 | 0.1319 | |||
| PSX / Phillips 66 | 0.13 | 1.07 | 14.91 | -2.35 | 1.0519 | 0.0281 | |||
| LMT / Lockheed Martin Corporation | 0.03 | -4.26 | 14.10 | -0.74 | 0.9942 | 0.0423 | |||
| DHR / Danaher Corporation | 0.06 | 0.00 | 12.78 | -3.63 | 0.9015 | 0.0124 | |||
| MDT / Medtronic plc | 0.14 | 0.00 | 12.64 | -2.99 | 0.8911 | 0.0181 | |||
| BRK.B / Berkshire Hathaway Inc. | 0.02 | 4.13 | 11.99 | -5.02 | 0.8453 | -0.0005 | |||
| LIN / Linde plc | 0.03 | 0.00 | 11.96 | 0.77 | 0.8438 | 0.0479 | |||
| ISRG / Intuitive Surgical, Inc. | 0.02 | 0.00 | 9.54 | 9.72 | 0.6725 | 0.0900 | |||
| MO / Altria Group, Inc. | 0.16 | -43.03 | 9.28 | -44.35 | 0.6548 | -0.4634 | |||
| ROP / Roper Technologies, Inc. | 0.02 | 0.00 | 8.84 | -3.86 | 0.6236 | 0.0072 | |||
| WAT / Waters Corporation | 0.02 | 0.00 | 8.03 | -5.31 | 0.5661 | -0.0020 | |||
| RSG / Republic Services, Inc. | 0.03 | 0.00 | 7.94 | 1.83 | 0.5600 | 0.0374 | |||
| AME / AMETEK, Inc. | 0.03 | 0.00 | 5.83 | 5.12 | 0.4114 | 0.0395 | |||
| BHP / BHP Group Limited - Depositary Receipt (Common Stock) | 0.12 | 0.00 | 5.72 | -0.93 | 0.4037 | 0.0164 | |||
| J / Jacobs Solutions Inc. | 0.04 | 0.00 | 5.63 | 8.74 | 0.3968 | 0.0500 | |||
| XOM / Exxon Mobil Corporation | 0.05 | 0.00 | 5.60 | -9.35 | 0.3952 | -0.0192 | |||
| ECL / Ecolab Inc. | 0.02 | 1.36 | 5.43 | 7.72 | 0.3828 | 0.0451 | |||
| MSFT / Microsoft Corporation | 0.01 | 0.00 | 5.11 | 32.49 | 0.3607 | 0.1020 | |||
| VHT / Vanguard World Fund - Vanguard Health Care ETF | 0.02 | 0.00 | 4.72 | -6.20 | 0.3331 | -0.0044 | |||
| PG / The Procter & Gamble Company | 0.03 | 0.00 | 4.58 | -6.52 | 0.3227 | -0.0054 | |||
| ABT / Abbott Laboratories | 0.03 | 0.00 | 4.47 | 2.52 | 0.3153 | 0.0230 | |||
| SOLV / Solventum Corporation | 0.06 | 0.00 | 4.26 | -0.26 | 0.3005 | 0.0142 | |||
| VEEV / Veeva Systems Inc. | 0.01 | 0.00 | 3.91 | 24.32 | 0.2754 | 0.0649 | |||
| BMY / Bristol-Myers Squibb Company | 0.08 | 0.00 | 3.76 | -24.09 | 0.2649 | -0.0668 | |||
| FTV / Fortive Corporation | 0.06 | 0.00 | 3.30 | -28.77 | 0.2324 | -0.0777 | |||
| VGIT / Vanguard Scottsdale Funds - Vanguard Intermediate-Term Treasury ETF | 0.05 | 0.00 | 3.29 | 0.67 | 0.2318 | 0.0130 | |||
| ADP / Automatic Data Processing, Inc. | 0.01 | 0.00 | 3.21 | 0.94 | 0.2262 | 0.0132 | |||
| TLT / iShares Trust - iShares 20+ Year Treasury Bond ETF | 0.03 | 0.00 | 3.05 | -3.05 | 0.2154 | 0.0042 | |||
| CI / The Cigna Group | 0.01 | 0.00 | 2.95 | 0.48 | 0.2078 | 0.0112 | |||
| BN / Brookfield Corporation | 0.04 | 0.00 | 2.71 | 18.01 | 0.1909 | 0.0372 | |||
| JKHY / Jack Henry & Associates, Inc. | 0.01 | 0.00 | 2.59 | -1.33 | 0.1827 | 0.0067 | |||
| VLTO / Veralto Corporation | 0.02 | 0.00 | 2.18 | 3.62 | 0.1534 | 0.0127 | |||
| VRSN / VeriSign, Inc. | 0.01 | 0.00 | 1.70 | 13.75 | 0.1202 | 0.0198 | |||
| NVO / Novo Nordisk A/S - Depositary Receipt (Common Stock) | 0.02 | 0.00 | 1.62 | -0.61 | 0.1144 | 0.0050 | |||
| TDG / TransDigm Group Incorporated | 0.00 | 0.00 | 1.61 | 9.89 | 0.1137 | 0.0154 | |||
| VNT / Vontier Corporation | 0.04 | 0.00 | 1.45 | 12.34 | 0.1022 | 0.0157 | |||
| MDLZ / Mondelez International, Inc. | 0.02 | 0.00 | 1.41 | -0.56 | 0.0994 | 0.0044 | |||
| COST / Costco Wholesale Corporation | 0.00 | 0.00 | 1.39 | 4.61 | 0.0977 | 0.0090 | |||
| TRMB / Trimble Inc. | 0.02 | 0.00 | 1.35 | 15.74 | 0.0950 | 0.0170 | |||
| ZTS / Zoetis Inc. | 0.01 | 1.18 | 0.0830 | 0.0830 | |||||
| AMTM / Amentum Holdings, Inc. | 0.05 | 6.08 | 1.07 | 37.66 | 0.0756 | 0.0234 | |||
| RAL / Ralliant Corporation | 0.02 | 1.02 | 0.0721 | 0.0721 | |||||
| WFC / Wells Fargo & Company | 0.01 | 0.00 | 0.85 | 11.53 | 0.0601 | 0.0089 | |||
| PPLT / abrdn Platinum ETF Trust - abrdn Physical Platinum Shares ETF | 0.01 | 0.80 | 0.0563 | 0.0563 | |||||
| VWO / Vanguard International Equity Index Funds - Vanguard FTSE Emerging Markets ETF | 0.02 | 0.00 | 0.78 | 9.27 | 0.0549 | 0.0072 | |||
| A / Agilent Technologies, Inc. | 0.01 | 252.78 | 0.76 | 256.13 | 0.0533 | 0.0391 | |||
| MRK / Merck & Co., Inc. | 0.01 | 0.00 | 0.70 | -11.77 | 0.0492 | -0.0038 | |||
| NTR / Nutrien Ltd. | 0.01 | 0.00 | 0.63 | 17.16 | 0.0444 | 0.0084 | |||
| VIG / Vanguard Specialized Funds - Vanguard Dividend Appreciation ETF | 0.00 | 0.60 | 0.0425 | 0.0425 | |||||
| MTD / Mettler-Toledo International Inc. | 0.00 | 199.38 | 0.57 | 197.89 | 0.0399 | 0.0272 | |||
| WDS / Woodside Energy Group Ltd - Depositary Receipt (Common Stock) | 0.04 | 0.00 | 0.55 | 6.45 | 0.0385 | 0.0041 | |||
| LEVI / Levi Strauss & Co. | 0.02 | 0.00 | 0.45 | 18.90 | 0.0319 | 0.0063 | |||
| CSD / Invesco Exchange-Traded Fund Trust - Invesco S&P Spin-Off ETF | 0.00 | 0.00 | 0.41 | 11.99 | 0.0290 | 0.0044 | |||
| VPL / Vanguard International Equity Index Funds - Vanguard FTSE Pacific ETF | 0.00 | 0.00 | 0.41 | 13.45 | 0.0286 | 0.0046 | |||
| URA / Global X Funds - Global X Uranium ETF | 0.01 | 0.37 | 0.0259 | 0.0259 | |||||
| ALSN / Allison Transmission Holdings, Inc. | 0.00 | 0.00 | 0.24 | -0.84 | 0.0167 | 0.0007 | |||
| AFL / Aflac Incorporated | 0.00 | 0.42 | 0.22 | -4.68 | 0.0158 | 0.0000 | |||
| OXY / Occidental Petroleum Corporation | 0.01 | 0.00 | 0.22 | -14.94 | 0.0157 | -0.0018 | |||
| FONR / FONAR Corporation | 0.01 | 0.00 | 0.21 | 6.57 | 0.0149 | 0.0016 | |||
| EWBC / East West Bancorp, Inc. | 0.00 | 0.00 | 0.20 | 12.29 | 0.0142 | 0.0022 | |||
| IBB / iShares Trust - iShares Biotechnology ETF | 0.00 | 0.00 | 0.17 | -1.14 | 0.0123 | 0.0005 | |||
| QQQ / Invesco QQQ Trust, Series 1 | 0.00 | 0.00 | 0.17 | 17.73 | 0.0117 | 0.0023 | |||
| IMXI / International Money Express, Inc. | 0.01 | 0.13 | 0.0090 | 0.0090 | |||||
| RPRX / Royalty Pharma plc | 0.00 | 0.00 | 0.08 | 14.49 | 0.0056 | 0.0010 | |||
| GNTX / Gentex Corporation | 0.00 | 0.00 | 0.04 | -6.38 | 0.0031 | -0.0000 | |||
| OGN / Organon & Co. | 0.00 | 0.00 | 0.01 | -37.50 | 0.0004 | -0.0002 | |||
| HII / Huntington Ingalls Industries, Inc. | 0.00 | -100.00 | 0.00 | 0.0000 |