Basic Stats
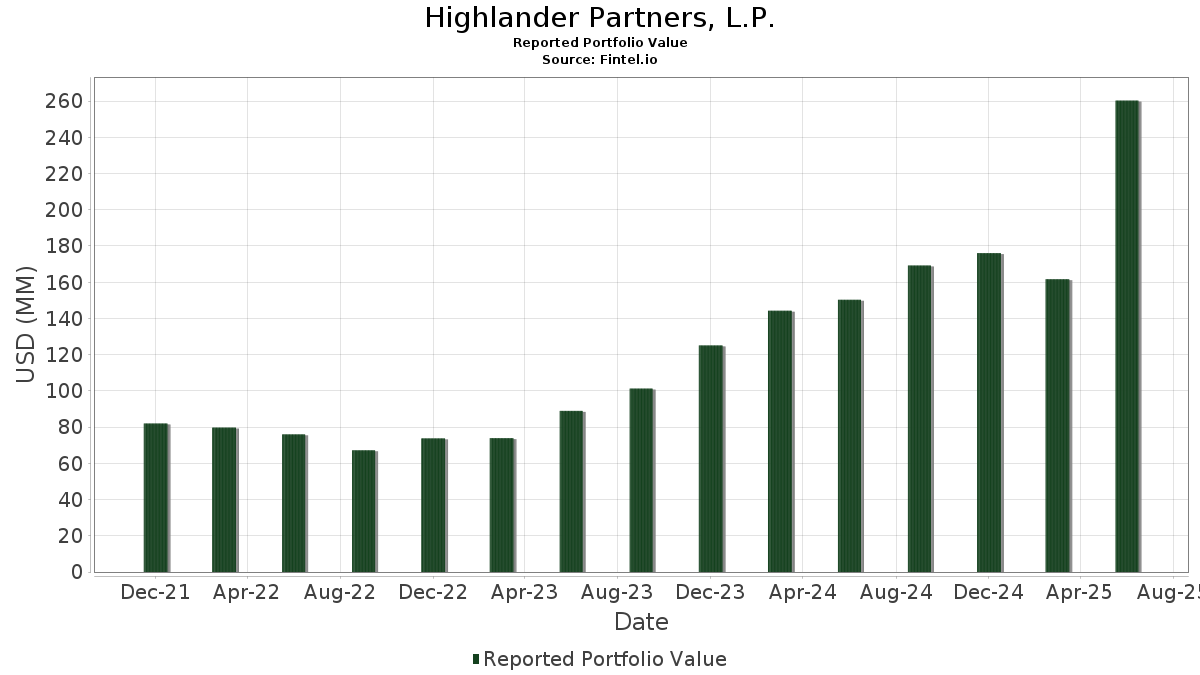
| Portfolio Value | $ 305,436,147 |
| Current Positions | 50 |
Latest Holdings, Performance, AUM (from 13F, 13D)
Highlander Partners, L.P. has disclosed 50 total holdings in their latest SEC filings. Most recent portfolio value is calculated to be $ 305,436,147 USD. Actual Assets Under Management (AUM) is this value plus cash (which is not disclosed). Highlander Partners, L.P.’s top holdings are Vertiv Holdings Co (US:VRT) , Blackstone Inc. (US:BX) , Amazon.com, Inc. (US:AMZN) , Full Truck Alliance Co. Ltd. - Depositary Receipt (Common Stock) (US:YMM) , and Texas Capital Bancshares, Inc. (US:TCBI) . Highlander Partners, L.P.’s new positions include SPDR Series Trust - SPDR S&P Regional Banking ETF (US:KRE) , Danaher Corporation (US:DHR) , Honeywell International Inc. (US:HON) , Parsons Corporation (US:PSN) , and SPX Technologies, Inc. (US:SPXC) .
Top Increases This Quarter
We use the change in the portfolio allocation because this is the most meaningful metric. Changes can be due to trades or changes in share prices.
| Security | Shares (MM) |
Value (MM$) |
Portfolio % | ΔPortfolio % |
|---|---|---|---|---|
| 0.20 | 11.88 | 3.8889 | 3.8889 | |
| 0.06 | 11.06 | 3.6218 | 3.6218 | |
| 0.05 | 10.60 | 3.4692 | 3.4692 | |
| 0.12 | 8.76 | 2.8667 | 2.8667 | |
| 0.04 | 6.92 | 2.2646 | 2.2646 | |
| 0.35 | 45.40 | 14.8646 | 1.7556 | |
| 0.08 | 12.98 | 4.2489 | 1.0802 | |
| 0.90 | 2.23 | 0.7308 | 0.1993 | |
| 0.24 | 36.50 | 11.9493 | 0.1774 | |
| 0.00 | 0.26 | 0.0837 | 0.0837 |
Top Decreases This Quarter
We use the change in the portfolio allocation because this is the most meaningful metric. Changes can be due to trades or changes in share prices.
| Security | Shares (MM) |
Value (MM$) |
Portfolio % | ΔPortfolio % |
|---|---|---|---|---|
| 1.49 | 17.58 | 5.7544 | -4.0049 | |
| 0.09 | 9.89 | 3.2378 | -2.6833 | |
| 0.10 | 22.60 | 7.3983 | -2.6650 | |
| 0.25 | 6.84 | 2.2409 | -1.3252 | |
| 0.08 | 6.77 | 2.2175 | -1.2913 | |
| 0.12 | 6.26 | 2.0490 | -0.7960 | |
| 0.40 | 6.05 | 1.9801 | -0.5217 | |
| 0.00 | 2.47 | 0.8091 | -0.3399 | |
| 0.00 | 0.74 | 0.2425 | -0.3181 | |
| 0.01 | 1.80 | 0.5891 | -0.2916 |
13F and Fund Filings
This form was filed on 2025-08-06 for the reporting period 2025-06-30. Click the link icon to see the full transaction history.
Upgrade to unlock premium data and export to Excel ![]() .
.
| Security | Type | Avg Share Price | Shares (MM) |
ΔShares (%) |
ΔShares (%) |
Value ($MM) |
Portfolio (%) |
ΔPortfolio (%) |
|
|---|---|---|---|---|---|---|---|---|---|
| VRT / Vertiv Holdings Co | 0.35 | 0.00 | 45.40 | 77.85 | 14.8646 | 1.7556 | |||
| BX / Blackstone Inc. | 0.24 | 48.78 | 36.50 | 59.22 | 11.9493 | 0.1774 | |||
| AMZN / Amazon.com, Inc. | 0.10 | 0.00 | 22.60 | 15.31 | 7.3983 | -2.6650 | |||
| YMM / Full Truck Alliance Co. Ltd. - Depositary Receipt (Common Stock) | 1.49 | 0.00 | 17.58 | -7.51 | 5.7544 | -4.0049 | |||
| TCBI / Texas Capital Bancshares, Inc. | 0.17 | 40.69 | 13.45 | 49.54 | 4.4046 | -0.2153 | |||
| KEYS / Keysight Technologies, Inc. | 0.08 | 92.23 | 12.98 | 110.32 | 4.2489 | 1.0802 | |||
| KRE / SPDR Series Trust - SPDR S&P Regional Banking ETF | 0.20 | 11.88 | 3.8889 | 3.8889 | |||||
| DHR / Danaher Corporation | 0.06 | 11.06 | 3.6218 | 3.6218 | |||||
| HON / Honeywell International Inc. | 0.05 | 10.60 | 3.4692 | 3.4692 | |||||
| BABA / Alibaba Group Holding Limited - Depositary Receipt (Common Stock) | 0.09 | 0.00 | 9.89 | -14.23 | 3.2378 | -2.6833 | |||
| PSN / Parsons Corporation | 0.12 | 8.76 | 2.8667 | 2.8667 | |||||
| SPXC / SPX Technologies, Inc. | 0.04 | 6.92 | 2.2646 | 2.2646 | |||||
| WSC / WillScot Holdings Corporation | 0.25 | 0.00 | 6.84 | -1.44 | 2.2409 | -1.3252 | |||
| SSNC / SS&C Technologies Holdings, Inc. | 0.08 | 0.00 | 6.77 | -0.86 | 2.2175 | -1.2913 | |||
| MIRM / Mirum Pharmaceuticals, Inc. | 0.12 | 0.00 | 6.26 | 12.96 | 2.0490 | -0.7960 | |||
| DAKT / Daktronics, Inc. | 0.40 | 0.00 | 6.05 | 24.14 | 1.9801 | -0.5217 | |||
| AMD / Advanced Micro Devices, Inc. | 0.04 | 0.00 | 5.11 | 38.13 | 1.6725 | -0.2268 | |||
| DELL / Dell Technologies Inc. | 0.03 | 0.00 | 3.68 | 34.53 | 1.2042 | -0.2000 | |||
| SPY / SPDR S&P 500 ETF | 0.00 | 0.00 | 2.47 | 10.46 | 0.8091 | -0.3399 | |||
| MDAI / Spectral AI, Inc. | 0.90 | 0.00 | 2.23 | 115.65 | 0.7308 | 0.1993 | |||
| PKB / Invesco Exchange-Traded Fund Trust - Invesco Building & Construction ETF | 0.01 | 0.00 | 1.80 | 4.96 | 0.5891 | -0.2916 | |||
| DMLP / Dorchester Minerals, L.P. - Limited Partnership | 0.03 | 0.00 | 0.92 | -7.34 | 0.3017 | -0.2092 | |||
| BRK.B / Berkshire Hathaway Inc. | 0.00 | -25.61 | 0.74 | -32.17 | 0.2425 | -0.3181 | |||
| MPLX / MPLX LP - Limited Partnership | 0.01 | 0.00 | 0.74 | -3.66 | 0.2410 | -0.1518 | |||
| CWST / Casella Waste Systems, Inc. | 0.01 | 0.00 | 0.69 | 3.44 | 0.2267 | -0.1169 | |||
| MSFT / Microsoft Corporation | 0.00 | 0.00 | 0.52 | 32.49 | 0.1710 | -0.0314 | |||
| GHC / Graham Holdings Company | 0.00 | 0.00 | 0.51 | -1.56 | 0.1657 | -0.0982 | |||
| WTM / White Mountains Insurance Group, Ltd. | 0.00 | 0.00 | 0.50 | -6.86 | 0.1646 | -0.1123 | |||
| PM / Philip Morris International Inc. | 0.00 | 0.00 | 0.46 | 14.90 | 0.1491 | -0.0547 | |||
| JPM / JPMorgan Chase & Co. | 0.00 | 0.00 | 0.43 | 18.26 | 0.1424 | -0.0466 | |||
| EPD / Enterprise Products Partners L.P. - Limited Partnership | 0.01 | 0.00 | 0.43 | -9.01 | 0.1421 | -0.1033 | |||
| META / Meta Platforms, Inc. | 0.00 | 0.00 | 0.41 | 28.16 | 0.1329 | -0.0299 | |||
| GOOGL / Alphabet Inc. | 0.00 | 0.00 | 0.39 | 13.82 | 0.1269 | -0.0478 | |||
| ADBE / Adobe Inc. | 0.00 | 0.00 | 0.39 | 0.78 | 0.1267 | -0.0703 | |||
| GLD / SPDR Gold Trust | 0.00 | 0.00 | 0.35 | 5.69 | 0.1158 | -0.0559 | |||
| FI / Fiserv, Inc. | 0.00 | 0.00 | 0.33 | -21.96 | 0.1072 | -0.1082 | |||
| ET / Energy Transfer LP - Limited Partnership | 0.02 | 0.00 | 0.31 | -2.52 | 0.1014 | -0.0617 | |||
| ARCC / Ares Capital Corporation | 0.01 | 0.00 | 0.31 | -0.97 | 0.1007 | -0.0587 | |||
| KRP / Kimbell Royalty Partners, LP - Limited Partnership | 0.02 | 8.37 | 0.31 | 8.10 | 0.1006 | -0.0454 | |||
| ACWI / iShares Trust - iShares MSCI ACWI ETF | 0.00 | 0.00 | 0.30 | 10.58 | 0.0994 | -0.0417 | |||
| PAGP / Plains GP Holdings, L.P. - Limited Partnership | 0.01 | 0.00 | 0.29 | -9.06 | 0.0954 | -0.0691 | |||
| MRK / Merck & Co., Inc. | 0.00 | 0.00 | 0.26 | -11.82 | 0.0855 | -0.0666 | |||
| ORCL / Oracle Corporation | 0.00 | 0.26 | 0.0837 | 0.0837 | |||||
| V / Visa Inc. | 0.00 | 0.00 | 0.25 | 1.22 | 0.0814 | -0.0446 | |||
| RSG / Republic Services, Inc. | 0.00 | 0.00 | 0.25 | 1.65 | 0.0807 | -0.0436 | |||
| PSX / Phillips 66 | 0.00 | 0.24 | 0.0781 | 0.0781 | |||||
| WES / Western Midstream Partners, LP - Limited Partnership | 0.01 | 0.00 | 0.24 | -5.22 | 0.0773 | -0.0510 | |||
| HD / The Home Depot, Inc. | 0.00 | 0.00 | 0.23 | 0.00 | 0.0750 | -0.0426 | |||
| FXI / iShares Trust - iShares China Large-Cap ETF | 0.01 | 0.00 | 0.22 | 2.33 | 0.0722 | -0.0382 | |||
| XOM / Exxon Mobil Corporation | 0.00 | 0.00 | 0.22 | -9.28 | 0.0706 | -0.0516 | |||
| NEOG / Neogen Corporation | 0.00 | -100.00 | 0.00 | 0.0000 | |||||
| SLB / Schlumberger Limited | 0.00 | -100.00 | 0.00 | 0.0000 |