Basic Stats
| Portfolio Value | $ 179,537,386 |
| Current Positions | 25 |
Latest Holdings, Performance, AUM (from 13F, 13D)
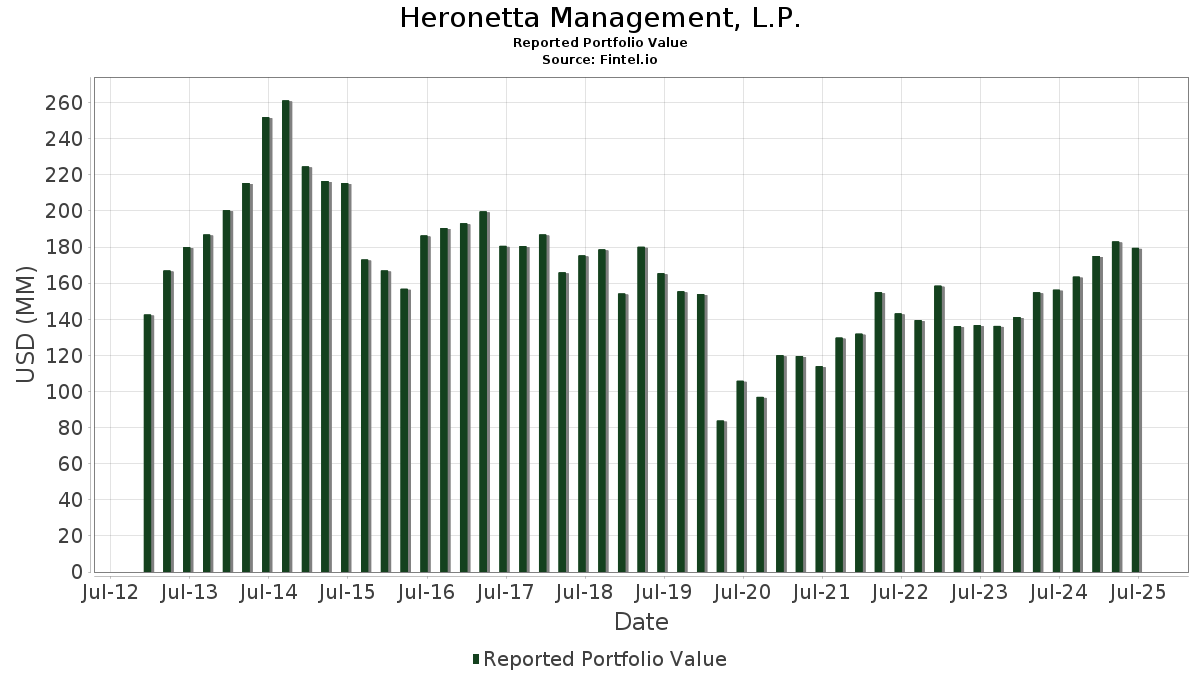
Heronetta Management, L.P. has disclosed 25 total holdings in their latest SEC filings. Most recent portfolio value is calculated to be $ 179,537,386 USD. Actual Assets Under Management (AUM) is this value plus cash (which is not disclosed). Heronetta Management, L.P.’s top holdings are MPLX LP - Limited Partnership (US:MPLX) , The Williams Companies, Inc. (US:WMB) , Enterprise Products Partners L.P. - Limited Partnership (US:EPD) , Energy Transfer LP - Limited Partnership (US:ET) , and ONEOK, Inc. (US:OKE) . Heronetta Management, L.P.’s new positions include Emera Incorporated (US:EMRAF) , .
Top Increases This Quarter
We use the change in the portfolio allocation because this is the most meaningful metric. Changes can be due to trades or changes in share prices.
| Security | Shares (MM) |
Value (MM$) |
Portfolio % | ΔPortfolio % |
|---|---|---|---|---|
| 0.07 | 4.15 | 2.3105 | 2.3105 | |
| 0.28 | 17.35 | 9.6654 | 0.6449 | |
| 0.09 | 9.66 | 5.3808 | 0.4535 | |
| 0.14 | 8.79 | 4.8941 | 0.2851 | |
| 0.05 | 7.58 | 4.2202 | 0.1345 | |
| 0.09 | 1.25 | 0.6955 | 0.1305 | |
| 0.10 | 2.80 | 1.5577 | 0.0750 | |
| 0.00 | 0.61 | 0.3387 | 0.0589 | |
| 0.09 | 5.59 | 3.1145 | 0.0345 | |
| 0.02 | 0.32 | 0.1785 | 0.0122 |
Top Decreases This Quarter
We use the change in the portfolio allocation because this is the most meaningful metric. Changes can be due to trades or changes in share prices.
| Security | Shares (MM) |
Value (MM$) |
Portfolio % | ΔPortfolio % |
|---|---|---|---|---|
| 0.16 | 12.80 | 7.1293 | -1.3708 | |
| 0.55 | 17.03 | 9.4867 | -0.7582 | |
| 0.20 | 9.87 | 5.4959 | -0.5518 | |
| 0.13 | 6.73 | 3.7504 | -0.2681 | |
| 0.19 | 11.68 | 6.5053 | -0.2081 | |
| 0.36 | 18.34 | 10.2156 | -0.1960 | |
| 0.10 | 3.96 | 2.2083 | -0.1705 | |
| 0.23 | 8.85 | 4.9273 | -0.1700 | |
| 0.20 | 3.86 | 2.1485 | -0.1435 | |
| 0.01 | 1.78 | 0.9931 | -0.1287 |
13F and Fund Filings
This form was filed on 2025-08-06 for the reporting period 2025-06-30. Click the link icon to see the full transaction history.
Upgrade to unlock premium data and export to Excel ![]() .
.
| Security | Type | Avg Share Price | Shares (MM) |
ΔShares (%) |
ΔShares (%) |
Value ($MM) |
Portfolio (%) |
ΔPortfolio (%) |
|
|---|---|---|---|---|---|---|---|---|---|
| MPLX / MPLX LP - Limited Partnership | 0.36 | 0.00 | 18.34 | -3.76 | 10.2156 | -0.1960 | |||
| WMB / The Williams Companies, Inc. | 0.28 | 0.00 | 17.35 | 5.10 | 9.6654 | 0.6449 | |||
| EPD / Enterprise Products Partners L.P. - Limited Partnership | 0.55 | 0.00 | 17.03 | -9.17 | 9.4867 | -0.7582 | |||
| ET / Energy Transfer LP - Limited Partnership | 0.88 | 0.00 | 16.03 | -2.48 | 8.9283 | -0.0518 | |||
| OKE / ONEOK, Inc. | 0.16 | 0.00 | 12.80 | -17.73 | 7.1293 | -1.3708 | |||
| EBGEF / Enbridge Inc. - Preferred Stock | 0.19 | -2.08 | 11.68 | -4.95 | 6.5053 | -0.2081 | |||
| PBA / Pembina Pipeline Corporation | 0.20 | 0.00 | 9.87 | -10.86 | 5.4959 | -0.5518 | |||
| CP / Canadian Pacific Kansas City Limited | 0.09 | 0.00 | 9.66 | 7.12 | 5.3808 | 0.4535 | |||
| WES / Western Midstream Partners, LP - Limited Partnership | 0.23 | 0.36 | 8.85 | -5.18 | 4.9273 | -0.1700 | |||
| TRP / TC Energy Corporation | 0.14 | 6.14 | 8.79 | 4.16 | 4.8941 | 0.2851 | |||
| CNQ / Canadian Natural Resources Limited | 0.19 | 0.00 | 8.29 | -3.34 | 4.6152 | -0.0684 | |||
| CNI / Canadian National Railway Company | 0.05 | 0.00 | 7.58 | 1.31 | 4.2202 | 0.1345 | |||
| SU / Suncor Energy Inc. | 0.13 | 0.00 | 6.73 | -8.46 | 3.7504 | -0.2681 | |||
| FTS / Fortis Inc. | 0.09 | 0.00 | 5.59 | -0.82 | 3.1145 | 0.0345 | |||
| EMRAF / Emera Incorporated | 0.07 | 4.15 | 2.3105 | 2.3105 | |||||
| HESM / Hess Midstream LP | 0.10 | 0.00 | 3.96 | -8.94 | 2.2083 | -0.1705 | |||
| PAGP / Plains GP Holdings, L.P. - Limited Partnership | 0.20 | 1.08 | 3.86 | -8.04 | 2.1485 | -0.1435 | |||
| KMI / Kinder Morgan, Inc. | 0.10 | 0.00 | 2.80 | 3.06 | 1.5577 | 0.0750 | |||
| TRGP / Targa Resources Corp. | 0.01 | 0.00 | 1.78 | -13.20 | 0.9931 | -0.1287 | |||
| SOBO / South Bow Corporation | 0.05 | 0.00 | 1.62 | -3.68 | 0.9040 | -0.0164 | |||
| TAC / TransAlta Corporation | 0.09 | 10.39 | 1.25 | 20.70 | 0.6955 | 0.1305 | |||
| LNG / Cheniere Energy, Inc. | 0.00 | 12.83 | 0.61 | 18.75 | 0.3387 | 0.0589 | |||
| CQP / Cheniere Energy Partners, L.P. - Limited Partnership | 0.01 | 0.00 | 0.33 | -15.14 | 0.1814 | -0.0282 | |||
| AM / Antero Midstream Corporation | 0.02 | 0.00 | 0.32 | 5.26 | 0.1785 | 0.0122 | |||
| CVE / Cenovus Energy Inc. | 0.01 | 0.00 | 0.28 | -7.67 | 0.1548 | -0.0091 |