Basic Stats
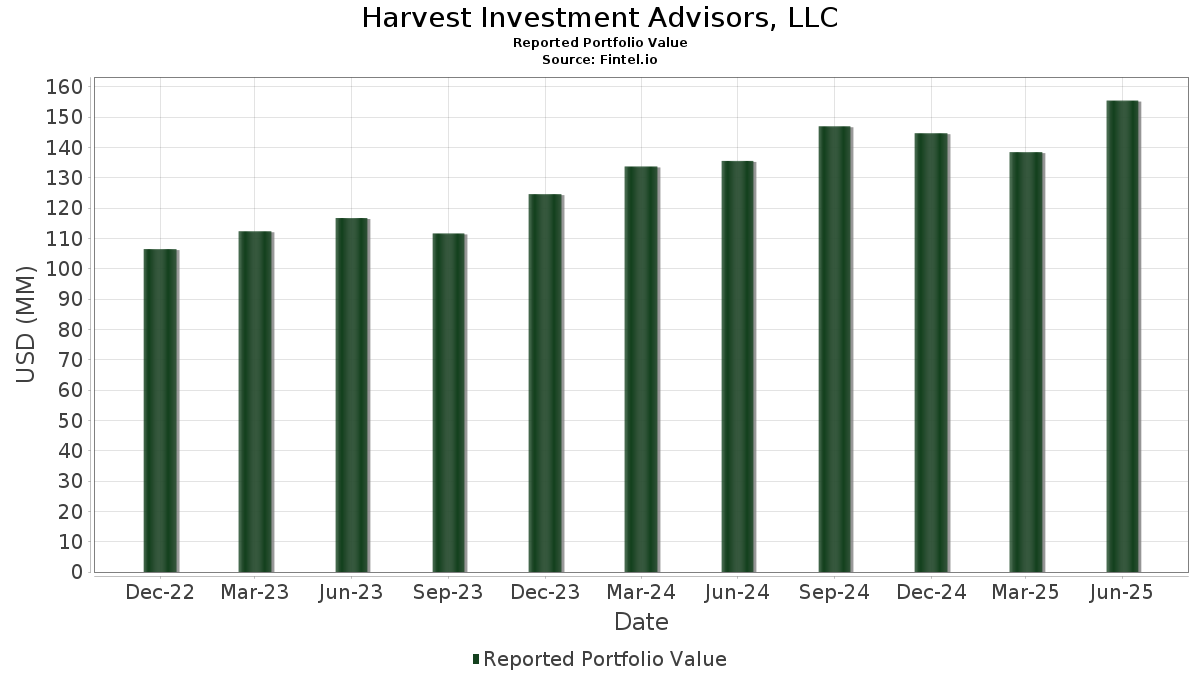
| Portfolio Value | $ 155,455,538 |
| Current Positions | 58 |
Latest Holdings, Performance, AUM (from 13F, 13D)
Harvest Investment Advisors, LLC has disclosed 58 total holdings in their latest SEC filings. Most recent portfolio value is calculated to be $ 155,455,538 USD. Actual Assets Under Management (AUM) is this value plus cash (which is not disclosed). Harvest Investment Advisors, LLC’s top holdings are Invesco QQQ Trust, Series 1 (US:QQQ) , iShares Trust - iShares MSCI EAFE ETF (US:EFA) , iShares Trust - iShares Russell 2000 ETF (US:IWM) , Fidelity Commonwealth Trust - Fidelity Nasdaq Composite Index ETF (US:ONEQ) , and iShares, Inc. - iShares MSCI Emerging Markets ETF (US:EEM) . Harvest Investment Advisors, LLC’s new positions include NXP Semiconductors N.V. (US:NXPI) , Microsoft Corporation (US:MSFT) , Alphabet Inc. (US:GOOGL) , Meta Platforms, Inc. (US:META) , and Eaton Corporation plc (US:ETN) .
Top Increases This Quarter
We use the change in the portfolio allocation because this is the most meaningful metric. Changes can be due to trades or changes in share prices.
| Security | Shares (MM) |
Value (MM$) |
Portfolio % | ΔPortfolio % |
|---|---|---|---|---|
| 0.01 | 1.78 | 1.1477 | 1.1477 | |
| 0.00 | 1.40 | 0.9026 | 0.9026 | |
| 0.06 | 31.94 | 20.5478 | 0.6745 | |
| 0.01 | 0.85 | 0.5465 | 0.5465 | |
| 0.00 | 0.46 | 0.2970 | 0.2970 | |
| 0.00 | 0.38 | 0.2450 | 0.2450 | |
| 0.00 | 0.35 | 0.2269 | 0.2269 | |
| 0.09 | 7.16 | 4.6053 | 0.1988 | |
| 0.00 | 0.30 | 0.1948 | 0.1948 | |
| 0.00 | 0.27 | 0.1715 | 0.1715 |
Top Decreases This Quarter
We use the change in the portfolio allocation because this is the most meaningful metric. Changes can be due to trades or changes in share prices.
| Security | Shares (MM) |
Value (MM$) |
Portfolio % | ΔPortfolio % |
|---|---|---|---|---|
| 0.01 | 1.83 | 1.1744 | -0.6913 | |
| 0.01 | 1.77 | 1.1382 | -0.6198 | |
| 0.01 | 1.56 | 1.0008 | -0.4262 | |
| 0.03 | 1.37 | 0.8816 | -0.4078 | |
| 0.01 | 2.14 | 1.3766 | -0.3736 | |
| 0.04 | 8.89 | 5.7219 | -0.3153 | |
| 0.13 | 11.75 | 7.5599 | -0.2685 | |
| 0.01 | 1.78 | 1.1451 | -0.2649 | |
| 0.01 | 2.00 | 1.2840 | -0.2084 | |
| 0.06 | 1.24 | 0.7951 | -0.1706 |
13F and Fund Filings
This form was filed on 2025-08-14 for the reporting period 2025-06-30. Click the link icon to see the full transaction history.
Upgrade to unlock premium data and export to Excel ![]() .
.
| Security | Type | Avg Share Price | Shares (MM) |
ΔShares (%) |
ΔShares (%) |
Value ($MM) |
Portfolio (%) |
ΔPortfolio (%) |
|
|---|---|---|---|---|---|---|---|---|---|
| QQQ / Invesco QQQ Trust, Series 1 | 0.06 | -1.32 | 31.94 | 16.09 | 20.5478 | 0.6745 | |||
| EFA / iShares Trust - iShares MSCI EAFE ETF | 0.13 | -0.86 | 11.75 | 8.43 | 7.5599 | -0.2685 | |||
| IWM / iShares Trust - iShares Russell 2000 ETF | 0.04 | -1.62 | 8.89 | 6.41 | 5.7219 | -0.3153 | |||
| ONEQ / Fidelity Commonwealth Trust - Fidelity Nasdaq Composite Index ETF | 0.09 | -0.28 | 7.16 | 17.36 | 4.6053 | 0.1988 | |||
| EEM / iShares, Inc. - iShares MSCI Emerging Markets ETF | 0.11 | -1.02 | 5.29 | 9.28 | 3.4019 | -0.0938 | |||
| VWO / Vanguard International Equity Index Funds - Vanguard FTSE Emerging Markets ETF | 0.10 | -1.25 | 4.88 | 7.90 | 3.1377 | -0.1270 | |||
| EMXC / iShares, Inc. - iShares MSCI Emerging Markets ex China ETF | 0.06 | 0.22 | 3.55 | 14.87 | 2.2864 | 0.0515 | |||
| GS / The Goldman Sachs Group, Inc. | 0.00 | -8.96 | 3.04 | 17.92 | 1.9559 | 0.0934 | |||
| MS / Morgan Stanley | 0.02 | -1.30 | 2.72 | 19.18 | 1.7514 | 0.1014 | |||
| SYF / Synchrony Financial | 0.04 | -1.56 | 2.50 | 24.08 | 1.6078 | 0.1531 | |||
| WMB / The Williams Companies, Inc. | 0.04 | -1.45 | 2.30 | 3.60 | 1.4796 | -0.1242 | |||
| BX / Blackstone Inc. | 0.01 | 0.71 | 2.23 | 7.78 | 1.4358 | -0.0597 | |||
| ABBV / AbbVie Inc. | 0.01 | -0.32 | 2.14 | -11.68 | 1.3766 | -0.3736 | |||
| NTRS / Northern Trust Corporation | 0.02 | -1.77 | 2.11 | 26.27 | 1.3542 | 0.1498 | |||
| STT / State Street Corporation | 0.02 | 1.40 | 2.09 | 20.48 | 1.3433 | 0.0911 | |||
| QCOM / QUALCOMM Incorporated | 0.01 | 5.64 | 2.05 | 9.51 | 1.3186 | -0.0332 | |||
| BLK / BlackRock, Inc. | 0.00 | -0.66 | 2.04 | 10.09 | 1.3128 | -0.0258 | |||
| HII / Huntington Ingalls Industries, Inc. | 0.01 | -0.06 | 2.04 | 18.21 | 1.3115 | 0.0663 | |||
| GD / General Dynamics Corporation | 0.01 | -0.34 | 2.04 | 6.65 | 1.3113 | -0.0694 | |||
| CSCO / Cisco Systems, Inc. | 0.03 | -1.18 | 2.01 | 11.10 | 1.2937 | -0.0136 | |||
| ALL / The Allstate Corporation | 0.01 | -0.62 | 2.00 | -3.39 | 1.2840 | -0.2084 | |||
| KMI / Kinder Morgan, Inc. | 0.07 | -0.61 | 1.97 | 2.40 | 1.2644 | -0.1219 | |||
| LHX / L3Harris Technologies, Inc. | 0.01 | -1.41 | 1.90 | 18.18 | 1.2212 | 0.0606 | |||
| PNC / The PNC Financial Services Group, Inc. | 0.01 | 2.14 | 1.86 | 8.38 | 1.1979 | -0.0434 | |||
| RTX / RTX Corporation | 0.01 | -35.88 | 1.83 | -29.35 | 1.1744 | -0.6913 | |||
| HON / Honeywell International Inc. | 0.01 | 0.17 | 1.82 | 10.21 | 1.1734 | -0.0227 | |||
| HSY / The Hershey Company | 0.01 | 0.99 | 1.82 | -1.99 | 1.1708 | -0.1705 | |||
| ABT / Abbott Laboratories | 0.01 | -1.33 | 1.81 | 1.17 | 1.1673 | -0.1282 | |||
| NXPI / NXP Semiconductors N.V. | 0.01 | 1.78 | 1.1477 | 1.1477 | |||||
| AMGN / Amgen Inc. | 0.01 | 1.74 | 1.78 | -8.81 | 1.1451 | -0.2649 | |||
| HIG / The Hartford Insurance Group, Inc. | 0.01 | -29.10 | 1.77 | -27.29 | 1.1382 | -0.6198 | |||
| LYB / LyondellBasell Industries N.V. | 0.03 | 39.69 | 1.71 | 14.84 | 1.1005 | 0.0244 | |||
| UPS / United Parcel Service, Inc. | 0.02 | 11.93 | 1.65 | 2.73 | 1.0634 | -0.0990 | |||
| TGT / Target Corporation | 0.02 | 21.39 | 1.64 | 14.74 | 1.0569 | 0.0228 | |||
| THO / THOR Industries, Inc. | 0.02 | 2.87 | 1.59 | 20.51 | 1.0245 | 0.0699 | |||
| WHR / Whirlpool Corporation | 0.02 | 11.12 | 1.59 | 25.04 | 1.0215 | 0.1039 | |||
| GNTX / Gentex Corporation | 0.07 | 3.61 | 1.58 | -2.23 | 1.0154 | -0.1506 | |||
| LEA / Lear Corporation | 0.02 | 3.12 | 1.57 | 10.96 | 1.0099 | -0.0115 | |||
| LMT / Lockheed Martin Corporation | 0.00 | 0.62 | 1.57 | 4.32 | 1.0096 | -0.0770 | |||
| GILD / Gilead Sciences, Inc. | 0.01 | -20.42 | 1.56 | -21.27 | 1.0008 | -0.4262 | |||
| KALU / Kaiser Aluminum Corporation | 0.02 | -1.57 | 1.55 | 29.82 | 0.9997 | 0.1345 | |||
| MAS / Masco Corporation | 0.02 | 3.52 | 1.54 | -4.18 | 0.9884 | -0.1698 | |||
| HD / The Home Depot, Inc. | 0.00 | 4.03 | 1.52 | 4.12 | 0.9749 | -0.0766 | |||
| GPC / Genuine Parts Company | 0.01 | 1.97 | 1.51 | 3.85 | 0.9715 | -0.0791 | |||
| DG / Dollar General Corporation | 0.01 | -1.29 | 1.49 | 28.35 | 0.9558 | 0.1201 | |||
| MSFT / Microsoft Corporation | 0.00 | 1.40 | 0.9026 | 0.9026 | |||||
| BMY / Bristol-Myers Squibb Company | 0.03 | 1.13 | 1.37 | -23.25 | 0.8816 | -0.4078 | |||
| SWKS / Skyworks Solutions, Inc. | 0.02 | 2.66 | 1.24 | 18.36 | 0.7966 | 0.0410 | |||
| HAL / Halliburton Company | 0.06 | 15.05 | 1.24 | -7.55 | 0.7951 | -0.1706 | |||
| DOW / Dow Inc. | 0.04 | 90.76 | 0.96 | 44.65 | 0.6170 | 0.1381 | |||
| CLX / The Clorox Company | 0.01 | 0.85 | 0.5465 | 0.5465 | |||||
| AAPL / Apple Inc. | 0.00 | 75.54 | 0.76 | 62.13 | 0.4907 | 0.1509 | |||
| AVGO / Broadcom Inc. | 0.00 | -25.13 | 0.69 | 23.21 | 0.4442 | 0.0396 | |||
| GOOGL / Alphabet Inc. | 0.00 | 0.46 | 0.2970 | 0.2970 | |||||
| META / Meta Platforms, Inc. | 0.00 | 0.38 | 0.2450 | 0.2450 | |||||
| ETN / Eaton Corporation plc | 0.00 | 0.35 | 0.2269 | 0.2269 | |||||
| AMZN / Amazon.com, Inc. | 0.00 | 0.30 | 0.1948 | 0.1948 | |||||
| GE / General Electric Company | 0.00 | 0.27 | 0.1715 | 0.1715 | |||||
| HUN / Huntsman Corporation | 0.00 | -100.00 | 0.00 | 0.0000 |