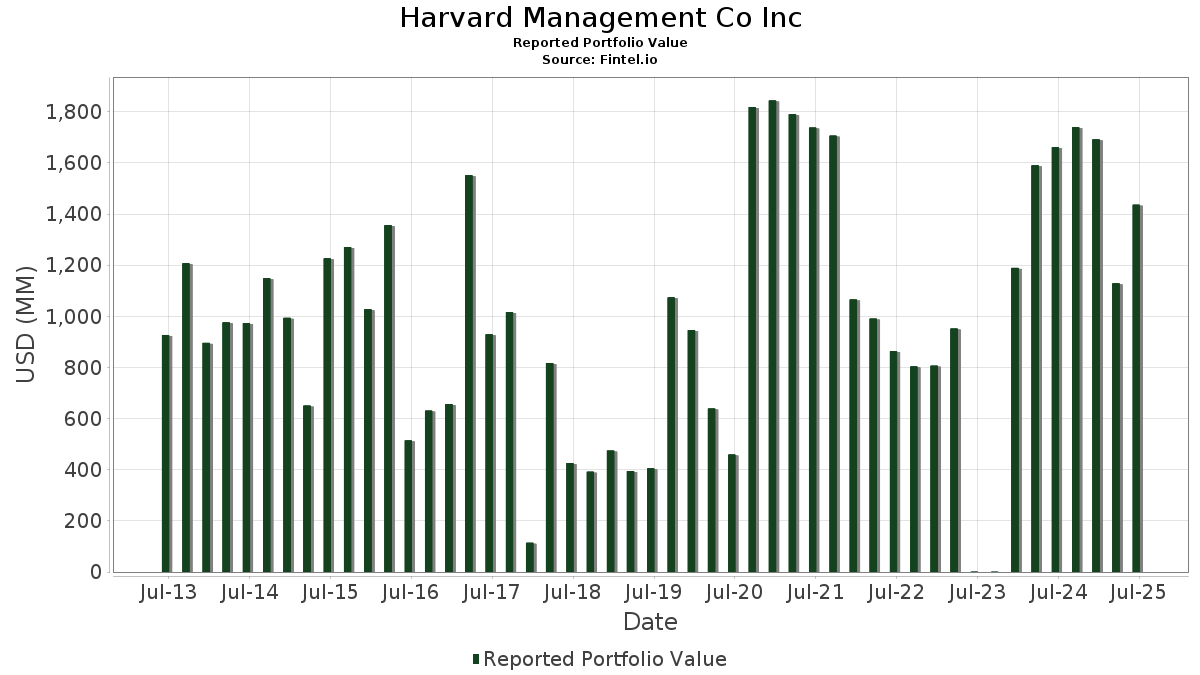
Basic Stats
| Portfolio Value | $ 1,436,154,595 |
| Current Positions | 14 |
Latest Holdings, Performance, AUM (from 13F, 13D)
Harvard Management Co Inc has disclosed 14 total holdings in their latest SEC filings. Most recent portfolio value is calculated to be $ 1,436,154,595 USD. Actual Assets Under Management (AUM) is this value plus cash (which is not disclosed). Harvard Management Co Inc’s top holdings are Microsoft Corporation (US:MSFT) , Amazon.com, Inc. (US:AMZN) , Booking Holdings Inc. (US:BKNG) , Meta Platforms, Inc. (US:META) , and iShares Bitcoin Trust ETF (US:IBIT) . Harvard Management Co Inc’s new positions include iShares Bitcoin Trust ETF (US:IBIT) , .
Top Increases This Quarter
We use the change in the portfolio allocation because this is the most meaningful metric. Changes can be due to trades or changes in share prices.
| Security | Shares (MM) |
Value (MM$) |
Portfolio % | ΔPortfolio % |
|---|---|---|---|---|
| 1.07 | 234.99 | 16.3623 | 16.3623 | |
| 1.91 | 116.67 | 8.1235 | 8.1235 | |
| 0.62 | 310.04 | 21.5879 | 7.6188 | |
| 0.33 | 101.51 | 7.0681 | 7.0681 | |
| 0.66 | 104.40 | 7.2697 | 2.3933 | |
| 1.90 | 26.07 | 1.8152 | 0.2835 | |
| 0.71 | 3.02 | 0.2104 | 0.1123 | |
| 0.17 | 1.97 | 0.1371 | 0.0056 |
Top Decreases This Quarter
We use the change in the portfolio allocation because this is the most meaningful metric. Changes can be due to trades or changes in share prices.
| Security | Shares (MM) |
Value (MM$) |
Portfolio % | ΔPortfolio % |
|---|---|---|---|---|
| 0.16 | 120.50 | 8.3905 | -17.0597 | |
| 0.00 | 0.00 | -8.8004 | ||
| 0.62 | 59.82 | 4.1650 | -3.9606 | |
| 0.03 | 182.36 | 12.6975 | -2.6499 | |
| 0.65 | 113.88 | 7.9295 | -1.9191 | |
| 0.19 | 53.12 | 3.6986 | -1.0736 | |
| 0.64 | 7.82 | 0.5447 | -0.0772 |
13F and Fund Filings
This form was filed on 2025-08-08 for the reporting period 2025-06-30. Click the link icon to see the full transaction history.
Upgrade to unlock premium data and export to Excel ![]() .
.
| Security | Type | Avg Share Price | Shares (MM) |
ΔShares (%) |
ΔShares (%) |
Value ($MM) |
Portfolio (%) |
ΔPortfolio (%) |
|
|---|---|---|---|---|---|---|---|---|---|
| MSFT / Microsoft Corporation | 0.62 | 48.40 | 310.04 | 96.64 | 21.5879 | 7.6188 | |||
| AMZN / Amazon.com, Inc. | 1.07 | 234.99 | 16.3623 | 16.3623 | |||||
| BKNG / Booking Holdings Inc. | 0.03 | -16.23 | 182.36 | 5.27 | 12.6975 | -2.6499 | |||
| META / Meta Platforms, Inc. | 0.16 | -67.24 | 120.50 | -58.05 | 8.3905 | -17.0597 | |||
| IBIT / iShares Bitcoin Trust ETF | 1.91 | 116.67 | 8.1235 | 8.1235 | |||||
| GOOGL / Alphabet Inc. | 0.65 | -10.10 | 113.88 | 2.45 | 7.9295 | -1.9191 | |||
| NVDA / NVIDIA Corporation | 0.66 | 30.13 | 104.40 | 89.69 | 7.2697 | 2.3933 | |||
| GLD / SPDR Gold Trust | 0.33 | 101.51 | 7.0681 | 7.0681 | |||||
| LNW / Light & Wonder, Inc. | 0.62 | -41.32 | 59.82 | -34.78 | 4.1650 | -3.9606 | |||
| AVGO / Broadcom Inc. | 0.19 | -40.10 | 53.12 | -1.38 | 3.6986 | -1.0736 | |||
| PCT / PureCycle Technologies, Inc. | 1.90 | -23.83 | 26.07 | 50.80 | 1.8152 | 0.2835 | |||
| MAZE / Maze Therapeutics, Inc. | 0.64 | 0.00 | 7.82 | 11.44 | 0.5447 | -0.0772 | |||
| PCTTW / PureCycle Technologies, Inc. - Equity Warrant | 0.71 | 0.00 | 3.02 | 172.90 | 0.2104 | 0.1123 | |||
| TXG / 10x Genomics, Inc. | 0.17 | 0.00 | 1.97 | 32.61 | 0.1371 | 0.0056 | |||
| QQQ / Invesco QQQ Trust, Series 1 | 0.00 | -100.00 | 0.00 | -100.00 | -8.8004 | ||||
| RBRK / Rubrik, Inc. | 0.00 | -100.00 | 0.00 | 0.0000 | |||||
| UBER / Uber Technologies, Inc. | 0.00 | -100.00 | 0.00 | 0.0000 |