Basic Stats
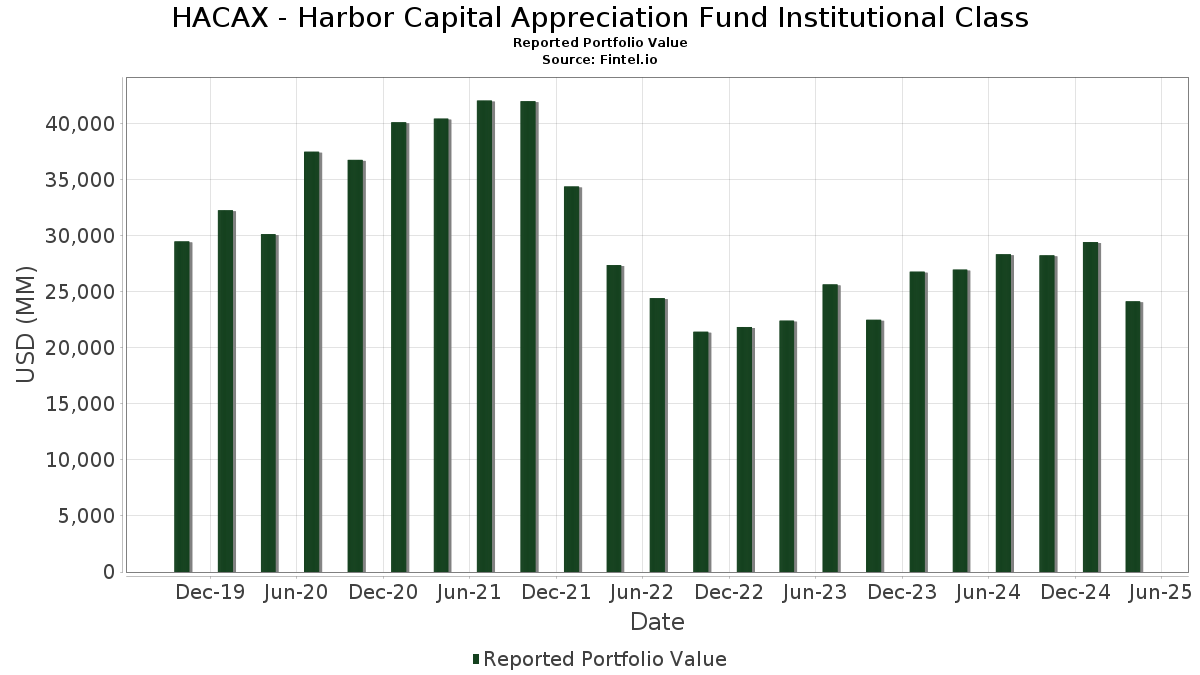
| Portfolio Value | $ 24,166,156,418 |
| Current Positions | 54 |
Latest Holdings, Performance, AUM (from 13F, 13D)
HACAX - Harbor Capital Appreciation Fund Institutional Class has disclosed 54 total holdings in their latest SEC filings. Most recent portfolio value is calculated to be $ 24,166,156,418 USD. Actual Assets Under Management (AUM) is this value plus cash (which is not disclosed). HACAX - Harbor Capital Appreciation Fund Institutional Class’s top holdings are NVIDIA Corporation (US:NVDA) , Amazon.com, Inc. (US:AMZN) , Microsoft Corporation (US:MSFT) , Netflix, Inc. (US:NFLX) , and Apple Inc. (US:AAPL) . HACAX - Harbor Capital Appreciation Fund Institutional Class’s new positions include Axon Enterprise, Inc. (US:AXON) , Texas Instruments Incorporated (US:TXN) , LPL Financial Holdings Inc. (US:LPLA) , .
Top Increases This Quarter
We use the change in the portfolio allocation because this is the most meaningful metric. Changes can be due to trades or changes in share prices.
| Security | Shares (MM) |
Value (MM$) |
Portfolio % | ΔPortfolio % |
|---|---|---|---|---|
| 1.26 | 1,426.04 | 5.6965 | 1.4184 | |
| 1.01 | 905.33 | 3.6165 | 0.7772 | |
| 1.05 | 533.63 | 2.1317 | 0.6159 | |
| 1.65 | 490.48 | 1.9593 | 0.5146 | |
| 0.20 | 120.84 | 0.4827 | 0.4827 | |
| 0.71 | 113.83 | 0.4547 | 0.4547 | |
| 1.48 | 810.96 | 3.2395 | 0.3828 | |
| 1.85 | 372.25 | 1.4870 | 0.3806 | |
| 0.13 | 314.25 | 1.2553 | 0.3545 | |
| 1.07 | 460.80 | 1.8407 | 0.3541 |
Top Decreases This Quarter
We use the change in the portfolio allocation because this is the most meaningful metric. Changes can be due to trades or changes in share prices.
| Security | Shares (MM) |
Value (MM$) |
Portfolio % | ΔPortfolio % |
|---|---|---|---|---|
| 9.85 | 1,815.79 | 7.2535 | -2.1387 | |
| 2.32 | 1,274.38 | 5.0907 | -1.5810 | |
| 1.85 | 520.76 | 2.0802 | -0.9779 | |
| 5.45 | 1,048.22 | 4.1873 | -0.5936 | |
| 3.24 | 294.81 | 1.1776 | -0.5119 | |
| 2.56 | 137.48 | 0.5492 | -0.5083 | |
| 0.75 | 202.41 | 0.8085 | -0.4536 | |
| 1.03 | 125.93 | 0.5030 | -0.3671 | |
| 3.50 | 555.33 | 2.2183 | -0.3214 | |
| 3.49 | 561.83 | 2.2443 | -0.3106 |
13F and Fund Filings
This form was filed on 2025-06-27 for the reporting period 2025-04-30. Click the link icon to see the full transaction history.
Upgrade to unlock premium data and export to Excel ![]() .
.
| Security | Type | Avg Share Price | Shares (MM) |
ΔShares (%) |
ΔShares (%) |
Value ($MM) |
Portfolio (%) |
ΔPortfolio (%) |
|
|---|---|---|---|---|---|---|---|---|---|
| NVDA / NVIDIA Corporation | 18.57 | -9.57 | 2,022.96 | -17.97 | 8.0810 | -0.2663 | |||
| AMZN / Amazon.com, Inc. | 9.85 | -15.66 | 1,815.79 | -34.56 | 7.2535 | -2.1387 | |||
| MSFT / Microsoft Corporation | 4.04 | -7.11 | 1,596.83 | -11.54 | 6.3788 | 0.2682 | |||
| NFLX / Netflix, Inc. | 1.26 | -2.62 | 1,426.04 | 12.83 | 5.6965 | 1.4184 | |||
| AAPL / Apple Inc. | 6.48 | -4.38 | 1,376.77 | -13.90 | 5.4997 | 0.0871 | |||
| META / Meta Platforms, Inc. | 2.32 | -18.83 | 1,274.38 | -35.34 | 5.0907 | -1.5810 | |||
| AVGO / Broadcom Inc. | 5.45 | -14.68 | 1,048.22 | -25.78 | 4.1873 | -0.5936 | |||
| LLY / Eli Lilly and Company | 1.01 | -2.62 | 905.33 | 7.93 | 3.6165 | 0.7772 | |||
| MA / Mastercard Incorporated | 1.48 | -2.62 | 810.96 | -3.91 | 3.2395 | 0.3828 | |||
| V / Visa Inc. | 1.78 | -2.62 | 614.11 | -1.56 | 2.4532 | 0.3414 | |||
| COST / Costco Wholesale Corporation | 0.61 | -2.62 | 609.43 | -1.16 | 2.4344 | 0.3473 | |||
| GOOG / Alphabet Inc. | 3.49 | -4.88 | 561.83 | -25.56 | 2.2443 | -0.3106 | |||
| GOOGL / Alphabet Inc. | 3.50 | -4.91 | 555.33 | -25.99 | 2.2183 | -0.3214 | |||
| VRTX / Vertex Pharmaceuticals Incorporated | 1.05 | 7.98 | 533.63 | 19.17 | 2.1317 | 0.6159 | |||
| TSLA / Tesla, Inc. | 1.85 | -17.35 | 520.76 | -42.36 | 2.0802 | -0.9779 | |||
| CDNS / Cadence Design Systems, Inc. | 1.65 | 14.87 | 490.48 | 14.92 | 1.9593 | 0.5146 | |||
| BA / The Boeing Company | 2.57 | -2.62 | 471.77 | 1.09 | 1.8846 | 0.3049 | |||
| CRWD / CrowdStrike Holdings, Inc. | 1.07 | -2.62 | 460.80 | 4.92 | 1.8407 | 0.3541 | |||
| WMT / Walmart Inc. | 4.22 | -2.62 | 410.49 | -3.52 | 1.6398 | 0.1996 | |||
| UBER / Uber Technologies, Inc. | 4.67 | -22.92 | 378.11 | -6.59 | 1.5104 | 0.1403 | |||
| GE / General Electric Company | 1.85 | 15.03 | 372.25 | 13.88 | 1.4870 | 0.3806 | |||
| MELI / MercadoLibre, Inc. | 0.13 | -2.62 | 314.25 | 18.08 | 1.2553 | 0.3545 | |||
| SPOT / Spotify Technology S.A. | 0.49 | -20.84 | 302.70 | -11.40 | 1.2092 | 0.0527 | |||
| NOW / ServiceNow, Inc. | 0.31 | -14.42 | 298.45 | -19.74 | 1.1922 | -0.0665 | |||
| ISRG / Intuitive Surgical, Inc. | 0.57 | -4.97 | 295.75 | -14.29 | 1.1814 | 0.0134 | |||
| DIS / The Walt Disney Company | 3.24 | -26.58 | 294.81 | -40.94 | 1.1776 | -0.5119 | |||
| ORLY / O'Reilly Automotive, Inc. | 0.20 | -16.14 | 283.59 | -8.31 | 1.1328 | 0.0859 | |||
| NVO / Novo Nordisk A/S - Depositary Receipt (Common Stock) | 4.11 | -2.62 | 273.03 | -23.37 | 1.0907 | -0.1154 | |||
| TJX / The TJX Companies, Inc. | 1.80 | -2.62 | 232.24 | 0.42 | 0.9277 | 0.1449 | |||
| HLT / Hilton Worldwide Holdings Inc. | 0.98 | -15.78 | 221.51 | -25.84 | 0.8848 | -0.1262 | |||
| CEG / Constellation Energy Corporation | 0.94 | 23.03 | 210.86 | -8.36 | 0.8423 | 0.0634 | |||
| PGR / The Progressive Corporation | 0.74 | -22.54 | 209.70 | -11.45 | 0.8377 | 0.0361 | |||
| EW / Edwards Lifesciences Corporation | 2.74 | 36.91 | 206.47 | 42.66 | 0.8248 | 0.3349 | |||
| CRM / Salesforce, Inc. | 0.75 | -30.97 | 202.41 | -45.72 | 0.8085 | -0.4536 | |||
| TSM / Taiwan Semiconductor Manufacturing Company Limited - Depositary Receipt (Common Stock) | 1.19 | 8.54 | 198.09 | -13.56 | 0.7913 | 0.0156 | |||
| ADS / adidas AG | 0.86 | -2.62 | 197.69 | -15.02 | 0.7897 | 0.0023 | |||
| SNOW / Snowflake Inc. | 1.19 | -18.57 | 189.63 | -28.45 | 0.7575 | -0.1396 | |||
| DXCM / DexCom, Inc. | 2.58 | -2.62 | 183.95 | -19.95 | 0.7348 | -0.0430 | |||
| AZN / AstraZeneca PLC - Depositary Receipt (Common Stock) | 2.44 | -21.33 | 175.08 | -20.19 | 0.6994 | -0.0432 | |||
| MCO / Moody's Corporation | 0.36 | -35.96 | 163.26 | -41.90 | 0.6522 | -0.2990 | |||
| IDEXY / Industria de Diseño Textil, S.A. - Depositary Receipt (Common Stock) | 2.77 | 13.55 | 149.09 | 12.49 | 0.5956 | 0.1469 | |||
| TTD / The Trade Desk, Inc. | 2.56 | -2.62 | 137.48 | -55.99 | 0.5492 | -0.5083 | |||
| GS / The Goldman Sachs Group, Inc. | 0.23 | -2.62 | 127.10 | -16.74 | 0.5077 | -0.0090 | |||
| ABNB / Airbnb, Inc. | 1.03 | -47.30 | 125.93 | -51.01 | 0.5030 | -0.3671 | |||
| NKE / NIKE, Inc. | 2.23 | 8.11 | 125.67 | -33.91 | 0.5020 | -0.2002 | |||
| DDOG / Datadog, Inc. | 1.23 | -21.30 | 125.50 | -43.66 | 0.5013 | -0.2527 | |||
| AXON / Axon Enterprise, Inc. | 0.20 | 120.84 | 0.4827 | 0.4827 | |||||
| TXN / Texas Instruments Incorporated | 0.71 | 113.83 | 0.4547 | 0.4547 | |||||
| ADBE / Adobe Inc. | 0.26 | -39.14 | 99.35 | -47.83 | 0.3969 | -0.2477 | |||
| SBUX / Starbucks Corporation | 1.21 | -27.82 | 96.95 | -46.34 | 0.3873 | -0.2243 | |||
| KKR / KKR & Co. Inc. | 0.68 | -23.11 | 78.08 | -47.41 | 0.3119 | -0.1906 | |||
| LPLA / LPL Financial Holdings Inc. | 0.24 | 76.52 | 0.3057 | 0.3057 | |||||
| CAVA / CAVA Group, Inc. | 0.64 | 34.22 | 59.60 | -8.14 | 0.2381 | 0.0185 | |||
| APP / AppLovin Corporation | 0.08 | -72.74 | 20.47 | -80.14 | 0.0818 | -0.2671 |