Basic Stats
| Portfolio Value | $ 5,588,618,413 |
| Current Positions | 103 |
Latest Holdings, Performance, AUM (from 13F, 13D)
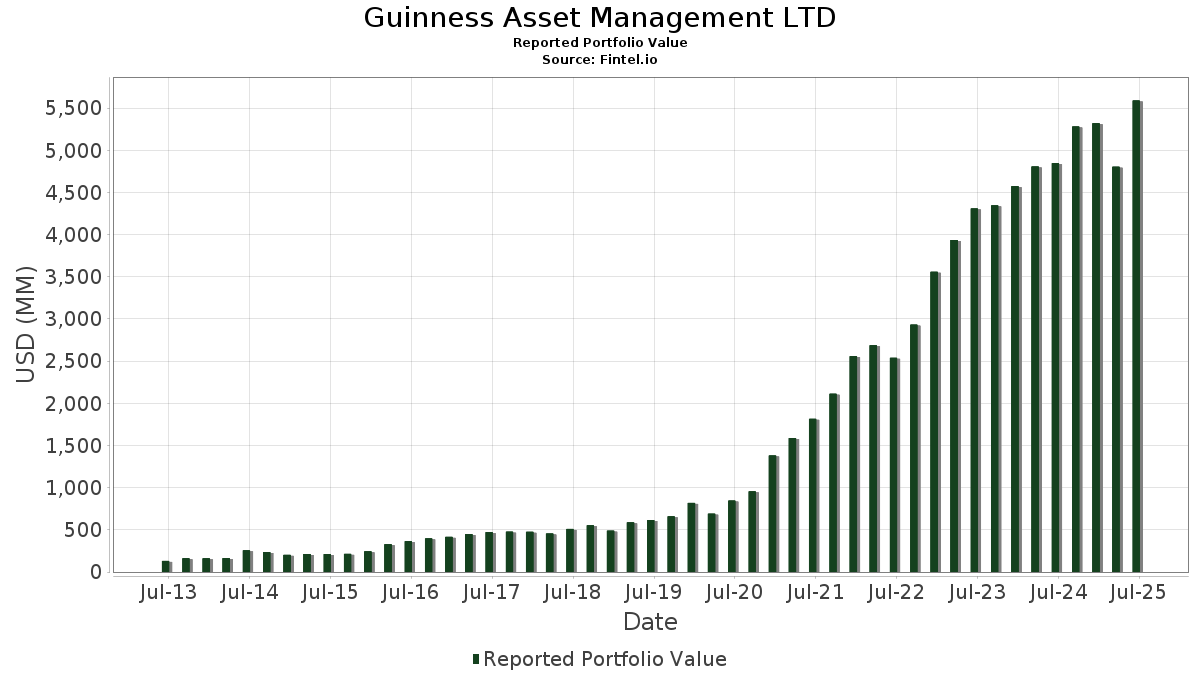
Guinness Asset Management LTD has disclosed 103 total holdings in their latest SEC filings. Most recent portfolio value is calculated to be $ 5,588,618,413 USD. Actual Assets Under Management (AUM) is this value plus cash (which is not disclosed). Guinness Asset Management LTD’s top holdings are Broadcom Inc. (US:AVGO) , Cisco Systems, Inc. (US:CSCO) , CME Group Inc. (US:CME) , Microsoft Corporation (US:MSFT) , and BlackRock, Inc. (US:BLK) . Guinness Asset Management LTD’s new positions include MSCI Inc. (US:MSCI) , Ralliant Corporation (US:RAL) , .
Top Increases This Quarter
We use the change in the portfolio allocation because this is the most meaningful metric. Changes can be due to trades or changes in share prices.
| Security | Shares (MM) |
Value (MM$) |
Portfolio % | ΔPortfolio % |
|---|---|---|---|---|
| 1.12 | 309.67 | 5.5412 | 1.6564 | |
| 0.55 | 274.53 | 4.9123 | 0.6342 | |
| 1.90 | 253.55 | 4.5369 | 0.2620 | |
| 0.39 | 88.77 | 1.5885 | 0.2271 | |
| 0.36 | 57.66 | 1.0318 | 0.1914 | |
| 0.72 | 71.51 | 1.2796 | 0.1149 | |
| 0.50 | 48.42 | 0.8664 | 0.0982 | |
| 0.06 | 52.43 | 0.9382 | 0.0929 | |
| 0.04 | 59.69 | 1.0681 | 0.0755 | |
| 0.07 | 54.72 | 0.9791 | 0.0731 |
Top Decreases This Quarter
We use the change in the portfolio allocation because this is the most meaningful metric. Changes can be due to trades or changes in share prices.
| Security | Shares (MM) |
Value (MM$) |
Portfolio % | ΔPortfolio % |
|---|---|---|---|---|
| 4.39 | 304.45 | 5.4477 | -45.9539 | |
| 2.37 | 250.19 | 4.4767 | -44.1217 | |
| 1.21 | 223.72 | 4.0032 | -1.1756 | |
| 0.83 | 266.02 | 4.7600 | -1.1229 | |
| 1.38 | 210.36 | 3.7642 | -0.9180 | |
| 1.63 | 237.09 | 4.2424 | -0.9128 | |
| 1.22 | 161.36 | 2.8873 | -0.8713 | |
| 1.23 | 196.54 | 3.5168 | -0.7920 | |
| 1.93 | 190.51 | 3.4089 | -0.6641 | |
| 3.18 | 225.29 | 4.0312 | -0.6440 |
13F and Fund Filings
This form was filed on 2025-08-01 for the reporting period 2025-06-30. Click the link icon to see the full transaction history.
Upgrade to unlock premium data and export to Excel ![]() .
.
| Security | Type | Avg Share Price | Shares (MM) |
ΔShares (%) |
ΔShares (%) |
Value ($MM) |
Portfolio (%) |
ΔPortfolio (%) |
|
|---|---|---|---|---|---|---|---|---|---|
| AVGO / Broadcom Inc. | 1.12 | 0.91 | 309.67 | 65.94 | 5.5412 | 1.6564 | |||
| CSCO / Cisco Systems, Inc. | 4.39 | 15.93 | 304.45 | 30.29 | 5.4477 | -45.9539 | |||
| CME / CME Group Inc. | 1.02 | 1.48 | 281.98 | 5.48 | 5.0456 | -0.5191 | |||
| MSFT / Microsoft Corporation | 0.55 | 0.84 | 274.53 | 33.58 | 4.9123 | 0.6342 | |||
| BLK / BlackRock, Inc. | 0.26 | 1.48 | 273.58 | 12.51 | 4.8952 | -0.1665 | |||
| AJG / Arthur J. Gallagher & Co. | 0.83 | 1.48 | 266.02 | -5.87 | 4.7600 | -1.1229 | |||
| EMR / Emerson Electric Co. | 1.90 | 1.48 | 253.55 | 23.47 | 4.5369 | 0.2620 | |||
| AFL / Aflac Incorporated | 2.37 | 19.40 | 250.19 | 13.24 | 4.4767 | -44.1217 | |||
| PAYX / Paychex, Inc. | 1.63 | 1.48 | 237.09 | -4.26 | 4.2424 | -0.9128 | |||
| KO / The Coca-Cola Company | 3.18 | 1.48 | 225.29 | 0.31 | 4.0312 | -0.6440 | |||
| ABBV / AbbVie Inc. | 1.21 | 1.48 | 223.72 | -10.07 | 4.0032 | -1.1756 | |||
| JNJ / Johnson & Johnson | 1.38 | 1.48 | 210.36 | -6.47 | 3.7642 | -0.9180 | |||
| TXN / Texas Instruments Incorporated | 1.01 | 1.48 | 208.95 | 17.35 | 3.7389 | 0.0322 | |||
| ITW / Illinois Tool Works Inc. | 0.84 | 1.48 | 206.52 | 1.23 | 3.6953 | -0.5516 | |||
| MDLZ / Mondelez International, Inc. | 3.03 | 1.48 | 204.38 | 0.91 | 3.6571 | -0.5589 | |||
| PG / The Procter & Gamble Company | 1.23 | 1.48 | 196.54 | -5.05 | 3.5168 | -0.7920 | |||
| OTIS / Otis Worldwide Corporation | 1.93 | 1.48 | 190.51 | -2.63 | 3.4089 | -0.6641 | |||
| PEP / PepsiCo, Inc. | 1.22 | 1.48 | 161.36 | -10.63 | 2.8873 | -0.8713 | |||
| TSM / Taiwan Semiconductor Manufacturing Company Limited - Depositary Receipt (Common Stock) | 0.39 | -0.74 | 88.77 | 35.75 | 1.5885 | 0.2271 | |||
| APH / Amphenol Corporation | 0.72 | -15.07 | 71.51 | 27.81 | 1.2796 | 0.1149 | |||
| NFLX / Netflix, Inc. | 0.04 | -12.81 | 59.69 | 25.18 | 1.0681 | 0.0755 | |||
| NVDA / NVIDIA Corporation | 0.36 | -2.01 | 57.66 | 42.83 | 1.0318 | 0.1914 | |||
| INTU / Intuit Inc. | 0.07 | -2.01 | 54.72 | 25.73 | 0.9791 | 0.0731 | |||
| META / Meta Platforms, Inc. | 0.07 | -2.01 | 54.62 | 25.48 | 0.9774 | 0.0712 | |||
| MA / Mastercard Incorporated | 0.09 | -2.01 | 52.55 | 0.46 | 0.9404 | -0.1487 | |||
| FTXP / Foothills Exploration, Inc. | 0.06 | -2.01 | 52.43 | 29.13 | 0.9382 | 0.0929 | |||
| ICE / Intercontinental Exchange, Inc. | 0.28 | -2.01 | 51.72 | 4.19 | 0.9255 | -0.1079 | |||
| V / Visa Inc. | 0.15 | -2.01 | 51.70 | -0.72 | 0.9252 | -0.1589 | |||
| LRCX / Lam Research Corporation | 0.50 | -2.01 | 48.42 | 31.21 | 0.8664 | 0.0982 | |||
| AMZN / Amazon.com, Inc. | 0.22 | -2.01 | 48.07 | 13.01 | 0.8602 | -0.0253 | |||
| AME / AMETEK, Inc. | 0.26 | -2.01 | 47.39 | 3.03 | 0.8480 | -0.1095 | |||
| GOOGL / Alphabet Inc. | 0.24 | -2.01 | 42.64 | 11.71 | 0.7630 | -0.0316 | |||
| ROP / Roper Technologies, Inc. | 0.07 | -1.05 | 41.51 | -4.85 | 0.7427 | -0.1654 | |||
| AMAT / Applied Materials, Inc. | 0.22 | -2.00 | 41.14 | 23.64 | 0.7361 | 0.0435 | |||
| DHR / Danaher Corporation | 0.20 | 14.37 | 38.86 | 10.22 | 0.6953 | -0.0386 | |||
| AAPL / Apple Inc. | 0.17 | -2.01 | 35.89 | -9.49 | 0.6421 | -0.1832 | |||
| CRM / Salesforce, Inc. | 0.13 | -2.01 | 35.60 | -0.43 | 0.6371 | -0.1073 | |||
| ADBE / Adobe Inc. | 0.09 | -2.01 | 33.36 | -1.16 | 0.5970 | -0.1057 | |||
| TMO / Thermo Fisher Scientific Inc. | 0.07 | -2.01 | 30.02 | -20.15 | 0.5372 | -0.2454 | |||
| HUBB / Hubbell Incorporated | 0.04 | -20.09 | 15.64 | -1.39 | 0.2798 | -0.0503 | |||
| NEE / NextEra Energy, Inc. | 0.20 | -25.39 | 13.92 | -26.85 | 0.2491 | -0.1470 | |||
| ITRI / Itron, Inc. | 0.10 | -28.19 | 12.97 | -9.71 | 0.2321 | -0.0670 | |||
| ORA / Ormat Technologies, Inc. | 0.15 | -25.21 | 12.20 | -11.45 | 0.2183 | -0.0685 | |||
| CVX / Chevron Corporation | 0.08 | -9.62 | 11.64 | -22.32 | 0.2082 | -0.1036 | |||
| XOM / Exxon Mobil Corporation | 0.11 | -9.90 | 11.57 | -17.71 | 0.2071 | -0.0856 | |||
| KMI / Kinder Morgan, Inc. | 0.34 | -9.85 | 9.88 | -7.27 | 0.1767 | -0.0450 | |||
| IMO / Imperial Oil Limited | 0.12 | -9.88 | 9.54 | -0.54 | 0.1708 | -0.0290 | |||
| NTES / NetEase, Inc. - Depositary Receipt (Common Stock) | 0.07 | -25.85 | 9.49 | -3.05 | 0.1698 | -0.0339 | |||
| FSLR / First Solar, Inc. | 0.06 | -20.28 | 9.44 | 4.04 | 0.1689 | -0.0200 | |||
| VLO / Valero Energy Corporation | 0.07 | -9.84 | 9.20 | -8.00 | 0.1646 | -0.0435 | |||
| SU / Suncor Energy Inc. | 0.25 | -9.84 | 9.19 | -12.43 | 0.1645 | -0.0540 | |||
| COP / ConocoPhillips | 0.10 | -9.86 | 9.10 | -22.31 | 0.1629 | -0.0810 | |||
| CSL / Carlisle Companies Incorporated | 0.02 | -20.18 | 9.03 | -12.46 | 0.1616 | -0.0532 | |||
| QCOM / QUALCOMM Incorporated | 0.06 | 11.64 | 8.82 | 15.75 | 0.1579 | -0.0008 | |||
| ON / ON Semiconductor Corporation | 0.16 | -20.20 | 8.65 | 2.82 | 0.1548 | -0.0203 | |||
| ENB / Enbridge Inc. | 0.19 | -9.85 | 8.47 | -8.10 | 0.1515 | -0.0403 | |||
| IBP / Installed Building Products, Inc. | 0.05 | -20.47 | 8.37 | -16.37 | 0.1498 | -0.0586 | |||
| EOG / EOG Resources, Inc. | 0.07 | -9.84 | 8.11 | -15.32 | 0.1451 | -0.0542 | |||
| CNQ / Canadian Natural Resources Limited | 0.25 | -9.68 | 7.94 | -7.45 | 0.1421 | -0.0365 | |||
| OC / Owens Corning | 0.06 | -20.46 | 7.58 | -23.38 | 0.1356 | -0.0703 | |||
| FANG / Diamondback Energy, Inc. | 0.05 | -9.85 | 6.44 | -21.77 | 0.1153 | -0.0562 | |||
| SLB / Schlumberger Limited | 0.17 | -9.85 | 5.85 | -26.93 | 0.1047 | -0.0620 | |||
| BKR / Baker Hughes Company | 0.15 | -9.84 | 5.73 | -21.05 | 0.1025 | -0.0486 | |||
| CVE / Cenovus Energy Inc. | 0.42 | -9.86 | 5.72 | -11.43 | 0.1023 | -0.0321 | |||
| DVN / Devon Energy Corporation | 0.16 | -9.86 | 5.18 | -22.64 | 0.0927 | -0.0467 | |||
| HAL / Halliburton Company | 0.22 | -9.85 | 4.54 | -27.12 | 0.0812 | -0.0484 | |||
| CSIQ / Canadian Solar Inc. | 0.39 | -31.48 | 4.35 | -12.61 | 0.0777 | -0.0258 | |||
| AMRC / Ameresco, Inc. | 0.24 | -20.08 | 3.68 | 0.44 | 0.0659 | -0.0104 | |||
| ENPH / Enphase Energy, Inc. | 0.08 | -26.55 | 3.06 | -53.00 | 0.0548 | -0.0808 | |||
| HLX / Helix Energy Solutions Group, Inc. | 0.22 | -9.72 | 1.36 | -32.22 | 0.0243 | -0.0174 | |||
| NDAQ / Nasdaq, Inc. | 0.01 | -2.34 | 0.87 | 15.17 | 0.0156 | -0.0002 | |||
| ARES / Ares Management Corporation | 0.00 | 2.36 | 0.82 | 20.83 | 0.0147 | 0.0006 | |||
| AMP / Ameriprise Financial, Inc. | 0.00 | 2.41 | 0.82 | 12.85 | 0.0146 | -0.0004 | |||
| STT / State Street Corporation | 0.01 | 2.37 | 0.77 | 21.75 | 0.0137 | 0.0006 | |||
| KKR / KKR & Co. Inc. | 0.01 | 2.38 | 0.72 | 17.76 | 0.0128 | 0.0002 | |||
| BX / Blackstone Inc. | 0.00 | 2.38 | 0.70 | 9.52 | 0.0126 | -0.0008 | |||
| CG / The Carlyle Group Inc. | 0.01 | 2.37 | 0.64 | 20.83 | 0.0114 | 0.0004 | |||
| RJF / Raymond James Financial, Inc. | 0.00 | 2.36 | 0.63 | 13.08 | 0.0113 | -0.0003 | |||
| AMG / Affiliated Managers Group, Inc. | 0.00 | 2.37 | 0.63 | 19.85 | 0.0113 | 0.0003 | |||
| APAM / Artisan Partners Asset Management Inc. | 0.01 | 2.37 | 0.48 | 16.11 | 0.0087 | -0.0000 | |||
| VRT / Vertiv Holdings Co | 0.00 | -18.76 | 0.44 | 44.41 | 0.0079 | 0.0015 | |||
| ANET / Arista Networks Inc | 0.00 | -6.26 | 0.43 | 23.56 | 0.0077 | 0.0005 | |||
| MSCI / MSCI Inc. | 0.00 | 0.43 | 0.0076 | 0.0076 | |||||
| ZBRA / Zebra Technologies Corporation | 0.00 | 18.31 | 0.42 | 29.27 | 0.0076 | 0.0008 | |||
| EW / Edwards Lifesciences Corporation | 0.01 | -15.25 | 0.42 | -8.42 | 0.0076 | -0.0021 | |||
| BEN / Franklin Resources, Inc. | 0.02 | 2.37 | 0.42 | 27.03 | 0.0076 | 0.0006 | |||
| ENTG / Entegris, Inc. | 0.01 | 11.53 | 0.42 | 2.94 | 0.0075 | -0.0010 | |||
| MPWR / Monolithic Power Systems, Inc. | 0.00 | -24.70 | 0.42 | -4.99 | 0.0075 | -0.0017 | |||
| CDNS / Cadence Design Systems, Inc. | 0.00 | -11.48 | 0.42 | 7.24 | 0.0074 | -0.0006 | |||
| ADUS / Addus HomeCare Corporation | 0.00 | 0.39 | 0.41 | 17.00 | 0.0074 | 0.0000 | |||
| TER / Teradyne, Inc. | 0.00 | 15.98 | 0.41 | 26.30 | 0.0074 | 0.0006 | |||
| RVTY / Revvity, Inc. | 0.00 | 6.19 | 0.41 | -2.85 | 0.0073 | -0.0014 | |||
| KEYS / Keysight Technologies, Inc. | 0.00 | -9.52 | 0.41 | -0.98 | 0.0073 | -0.0013 | |||
| A / Agilent Technologies, Inc. | 0.00 | 8.59 | 0.40 | 9.54 | 0.0072 | -0.0004 | |||
| WMS / Advanced Drainage Systems, Inc. | 0.00 | -3.98 | 0.40 | 1.52 | 0.0072 | -0.0010 | |||
| IEX / IDEX Corporation | 0.00 | 8.03 | 0.39 | 4.79 | 0.0071 | -0.0008 | |||
| TROW / T. Rowe Price Group, Inc. | 0.00 | 2.37 | 0.35 | 7.38 | 0.0063 | -0.0005 | |||
| FTV / Fortive Corporation | 0.01 | -7.05 | 0.29 | -33.79 | 0.0052 | -0.0040 | |||
| BIDU / Baidu, Inc. - Depositary Receipt (Common Stock) | 0.00 | 2.98 | 0.24 | -4.07 | 0.0042 | -0.0009 | |||
| JD / JD.com, Inc. - Depositary Receipt (Common Stock) | 0.00 | 4.89 | 0.13 | -17.22 | 0.0023 | -0.0009 | |||
| RAL / Ralliant Corporation | 0.00 | 0.09 | 0.0015 | 0.0015 | |||||
| BABA / Alibaba Group Holding Limited - Depositary Receipt (Common Stock) | 0.00 | 13.28 | 0.06 | -3.08 | 0.0011 | -0.0002 | |||
| ATHM / Autohome Inc. - Depositary Receipt (Common Stock) | 0.00 | 13.35 | 0.06 | 5.56 | 0.0010 | -0.0001 | |||
| TTEK / Tetra Tech, Inc. | 0.00 | -100.00 | 0.00 | -100.00 | -0.0068 |