Basic Stats
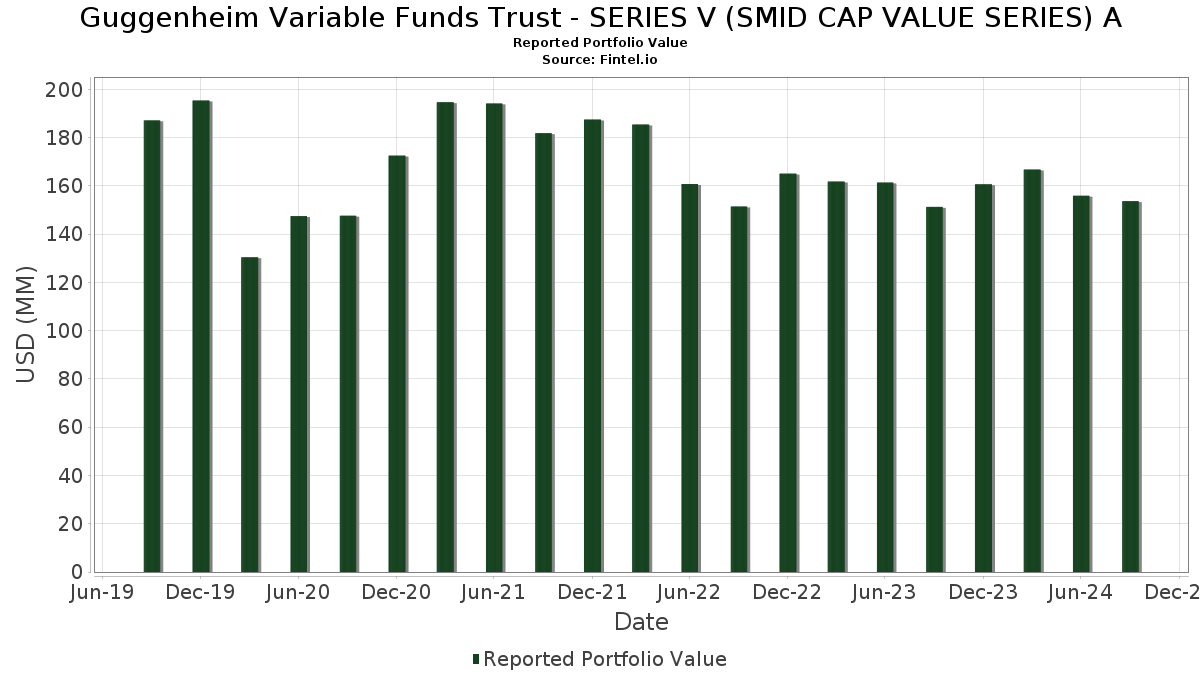
| Portfolio Value | $ 153,627,999 |
| Current Positions | 88 |
Latest Holdings, Performance, AUM (from 13F, 13D)
Guggenheim Variable Funds Trust - SERIES V (SMID CAP VALUE SERIES) A has disclosed 88 total holdings in their latest SEC filings. Most recent portfolio value is calculated to be $ 153,627,999 USD. Actual Assets Under Management (AUM) is this value plus cash (which is not disclosed). Guggenheim Variable Funds Trust - SERIES V (SMID CAP VALUE SERIES) A’s top holdings are Dreyfus Treasury Securities Cash Management - Dreyfus Treasury Securities Cash Management Institutional Shares (US:DIRXX) , Pinnacle West Capital Corporation (US:PNW) , OGE Energy Corp. (US:OGE) , Evergy, Inc. (US:EVRG) , and Teledyne Technologies Incorporated (US:TDY) .
Top Increases This Quarter
We use the change in the portfolio allocation because this is the most meaningful metric. Changes can be due to trades or changes in share prices.
| Security | Shares (MM) |
Value (MM$) |
Portfolio % | ΔPortfolio % |
|---|---|---|---|---|
| 0.03 | 3.72 | 2.4197 | 0.3602 | |
| 0.01 | 2.31 | 1.5002 | 0.3362 | |
| 0.06 | 3.91 | 2.5429 | 0.3277 | |
| 0.05 | 4.11 | 2.6731 | 0.3227 | |
| 5.56 | 5.56 | 3.6170 | 0.3002 | |
| 0.10 | 3.92 | 2.5507 | 0.2868 | |
| 0.03 | 2.42 | 1.5776 | 0.2664 | |
| 0.01 | 3.85 | 2.5026 | 0.2400 | |
| 0.02 | 2.44 | 1.5861 | 0.2208 | |
| 0.07 | 1.21 | 0.7864 | 0.2080 |
Top Decreases This Quarter
We use the change in the portfolio allocation because this is the most meaningful metric. Changes can be due to trades or changes in share prices.
| Security | Shares (MM) |
Value (MM$) |
Portfolio % | ΔPortfolio % |
|---|---|---|---|---|
| 0.01 | 0.90 | 0.5845 | -0.5272 | |
| 0.06 | 3.52 | 2.2925 | -0.5254 | |
| 0.05 | 3.11 | 2.0267 | -0.4654 | |
| 0.02 | 3.16 | 2.0562 | -0.3664 | |
| 0.02 | 2.81 | 1.8303 | -0.3372 | |
| 0.05 | 1.47 | 0.9549 | -0.3187 | |
| 0.03 | 3.19 | 2.0783 | -0.2927 | |
| 0.09 | 3.01 | 1.9620 | -0.2650 | |
| 0.04 | 1.34 | 0.8732 | -0.2152 | |
| 0.01 | 0.46 | 0.2967 | -0.1948 |
13F and Fund Filings
This form was filed on 2024-11-29 for the reporting period 2024-09-30. Click the link icon to see the full transaction history.
Upgrade to unlock premium data and export to Excel ![]() .
.
| Security | Type | Avg Share Price | Shares (MM) |
ΔShares (%) |
ΔShares (%) |
Value ($MM) |
Portfolio (%) |
ΔPortfolio (%) |
|
|---|---|---|---|---|---|---|---|---|---|
| DIRXX / Dreyfus Treasury Securities Cash Management - Dreyfus Treasury Securities Cash Management Institutional Shares | 5.56 | 7.50 | 5.56 | 7.50 | 3.6170 | 0.3002 | |||
| PNW / Pinnacle West Capital Corporation | 0.05 | -3.34 | 4.11 | 12.09 | 2.6731 | 0.3227 | |||
| OGE / OGE Energy Corp. | 0.10 | -3.34 | 3.92 | 11.05 | 2.5507 | 0.2868 | |||
| EVRG / Evergy, Inc. | 0.06 | -3.34 | 3.91 | 13.15 | 2.5429 | 0.3277 | |||
| TDY / Teledyne Technologies Incorporated | 0.01 | -3.34 | 3.85 | 9.02 | 2.5026 | 0.2400 | |||
| INGR / Ingredion Incorporated | 0.03 | -3.34 | 3.72 | 15.83 | 2.4197 | 0.3602 | |||
| UNM / Unum Group | 0.06 | -31.04 | 3.52 | -19.81 | 2.2925 | -0.5254 | |||
| SF / Stifel Financial Corp. | 0.03 | -22.57 | 3.19 | -13.61 | 2.0783 | -0.2927 | |||
| CW / Curtiss-Wright Corporation | 0.01 | -16.95 | 3.18 | 0.73 | 2.0673 | 0.0443 | |||
| TER / Teradyne, Inc. | 0.02 | -7.36 | 3.16 | -16.34 | 2.0562 | -0.3664 | |||
| EHC / Encompass Health Corporation | 0.03 | -17.54 | 3.12 | -7.10 | 2.0280 | -0.1240 | |||
| JEF / Jefferies Financial Group Inc. | 0.05 | -35.19 | 3.11 | -19.82 | 2.0267 | -0.4654 | |||
| LDOS / Leidos Holdings, Inc. | 0.02 | -3.34 | 3.04 | 8.03 | 1.9798 | 0.1728 | |||
| ORI / Old Republic International Corporation | 0.09 | -24.24 | 3.01 | -13.17 | 1.9620 | -0.2650 | |||
| MGPI / MGP Ingredients, Inc. | 0.04 | -14.38 | 2.96 | -4.18 | 1.9232 | -0.0556 | |||
| GPK / Graphic Packaging Holding Company | 0.10 | -12.72 | 2.94 | -1.48 | 1.9118 | -0.0008 | |||
| KEX / Kirby Corporation | 0.02 | -3.34 | 2.93 | -1.18 | 1.9040 | 0.0051 | |||
| FANG / Diamondback Energy, Inc. | 0.02 | -3.34 | 2.81 | -16.76 | 1.8303 | -0.3372 | |||
| ITGR / Integer Holdings Corporation | 0.02 | -3.34 | 2.80 | 8.52 | 1.8232 | 0.1671 | |||
| EEFT / Euronet Worldwide, Inc. | 0.03 | -3.34 | 2.69 | -7.34 | 1.7502 | -0.1115 | |||
| SAIC / Science Applications International Corporation | 0.02 | -3.34 | 2.44 | 14.52 | 1.5861 | 0.2208 | |||
| COHR / Coherent Corp. | 0.03 | -3.34 | 2.42 | 18.65 | 1.5776 | 0.2664 | |||
| RS / Reliance, Inc. | 0.01 | -3.34 | 2.39 | -2.13 | 1.5582 | -0.0110 | |||
| FHN / First Horizon Corporation | 0.15 | -3.34 | 2.36 | -4.84 | 1.5363 | -0.0547 | |||
| JLL / Jones Lang LaSalle Incorporated | 0.01 | -3.34 | 2.31 | 27.07 | 1.5002 | 0.3362 | |||
| HEES / H&E Equipment Services, Inc. | 0.05 | -3.34 | 2.28 | 6.53 | 1.4867 | 0.1110 | |||
| MTSI / MACOM Technology Solutions Holdings, Inc. | 0.02 | -3.34 | 2.28 | -3.52 | 1.4805 | -0.0322 | |||
| SUM / Summit Materials, Inc. | 0.06 | -3.34 | 2.22 | 3.06 | 1.4477 | 0.0629 | |||
| KNX / Knight-Swift Transportation Holdings Inc. | 0.04 | -3.34 | 2.22 | 4.47 | 1.4456 | 0.0815 | |||
| PB / Prosperity Bancshares, Inc. | 0.03 | -3.34 | 2.21 | 13.95 | 1.4350 | 0.1935 | |||
| AVNT / Avient Corporation | 0.04 | -3.34 | 2.20 | 11.45 | 1.4313 | 0.1651 | |||
| ARE / Alexandria Real Estate Equities, Inc. | 0.02 | -3.34 | 2.18 | -1.89 | 1.4197 | -0.0064 | |||
| ACA / Arcosa, Inc. | 0.02 | -3.34 | 2.11 | 9.84 | 1.3726 | 0.1405 | |||
| WLK / Westlake Corporation | 0.01 | -3.34 | 1.88 | 0.32 | 1.2260 | 0.0212 | |||
| RDNT / RadNet, Inc. | 0.03 | -3.34 | 1.87 | 13.85 | 1.2198 | 0.1635 | |||
| ENOV / Enovis Corporation | 0.04 | -3.34 | 1.87 | -7.93 | 1.2170 | -0.0861 | |||
| MSM / MSC Industrial Direct Co., Inc. | 0.02 | -3.34 | 1.85 | 4.89 | 1.2008 | 0.0723 | |||
| ESAB / ESAB Corporation | 0.02 | -3.34 | 1.83 | 8.83 | 1.1876 | 0.1118 | |||
| JCI / Johnson Controls International plc | 0.02 | -3.34 | 1.82 | 12.80 | 1.1817 | 0.1496 | |||
| AEIS / Advanced Energy Industries, Inc. | 0.02 | -3.34 | 1.81 | -6.45 | 1.1801 | -0.0637 | |||
| MDU / MDU Resources Group, Inc. | 0.07 | -3.34 | 1.80 | 5.57 | 1.1715 | 0.0775 | |||
| FRME / First Merchants Corporation | 0.05 | -3.34 | 1.76 | 8.05 | 1.1449 | 0.1000 | |||
| HUN / Huntsman Corporation | 0.06 | -3.34 | 1.50 | 2.74 | 0.9749 | 0.0394 | |||
| STC / Stewart Information Services Corporation | 0.02 | -3.34 | 1.49 | 16.38 | 0.9712 | 0.1485 | |||
| AMKR / Amkor Technology, Inc. | 0.05 | -3.34 | 1.47 | -26.10 | 0.9549 | -0.3187 | |||
| ASH / Ashland Inc. | 0.02 | -3.34 | 1.44 | -11.03 | 0.9348 | -0.1010 | |||
| CENTA / Central Garden & Pet Company | 0.04 | -3.34 | 1.40 | -8.13 | 0.9130 | -0.0664 | |||
| SAH / Sonic Automotive, Inc. | 0.02 | -3.34 | 1.34 | 3.79 | 0.8738 | 0.0438 | |||
| MUR / Murphy Oil Corporation | 0.04 | -3.34 | 1.34 | -20.93 | 0.8732 | -0.2152 | |||
| ICFI / ICF International, Inc. | 0.01 | -3.34 | 1.32 | 8.58 | 0.8568 | 0.0790 | |||
| NUE / Nucor Corporation | 0.01 | -3.34 | 1.31 | -8.06 | 0.8542 | -0.0618 | |||
| LBRT / Liberty Energy Inc. | 0.07 | -3.34 | 1.27 | -11.67 | 0.8272 | -0.0959 | |||
| AOS / A. O. Smith Corporation | 0.01 | -3.34 | 1.23 | 6.24 | 0.7974 | 0.0571 | |||
| MP / MP Materials Corp. | 0.07 | -3.34 | 1.21 | 34.07 | 0.7864 | 0.2080 | |||
| CIEN / Ciena Corporation | 0.02 | -3.34 | 1.18 | 23.56 | 0.7685 | 0.1554 | |||
| WETF / Wisdomtree Investments Inc | 0.12 | -3.34 | 1.16 | -2.53 | 0.7530 | -0.0088 | |||
| APLE / Apple Hospitality REIT, Inc. | 0.07 | -3.34 | 1.10 | -1.26 | 0.7136 | 0.0011 | |||
| EQT / EQT Corporation | 0.03 | -3.34 | 1.08 | -4.25 | 0.7043 | -0.0206 | |||
| LFUS / Littelfuse, Inc. | 0.00 | -3.35 | 1.06 | 0.28 | 0.6929 | 0.0120 | |||
| AX / Axos Financial, Inc. | 0.02 | -3.34 | 1.06 | 6.31 | 0.6908 | 0.0505 | |||
| RL / Ralph Lauren Corporation | 0.01 | -3.34 | 1.04 | 7.02 | 0.6753 | 0.0534 | |||
| CALX / Calix, Inc. | 0.03 | -3.34 | 1.03 | 5.84 | 0.6725 | 0.0461 | |||
| KMI / Kinder Morgan, Inc. | 0.05 | -3.34 | 1.02 | 7.45 | 0.6668 | 0.0551 | |||
| AN / AutoNation, Inc. | 0.01 | -3.33 | 0.98 | 8.57 | 0.6348 | 0.0582 | |||
| PKE / Park Aerospace Corp. | 0.07 | -3.34 | 0.93 | -7.94 | 0.6040 | -0.0427 | |||
| CROX / Crocs, Inc. | 0.01 | -47.77 | 0.90 | -48.15 | 0.5845 | -0.5272 | |||
| BKH / Black Hills Corporation | 0.01 | -3.34 | 0.88 | 8.64 | 0.5727 | 0.0530 | |||
| TKR / The Timken Company | 0.01 | -3.34 | 0.84 | 1.57 | 0.5466 | 0.0167 | |||
| LIVN / LivaNova PLC | 0.02 | -3.34 | 0.83 | -7.44 | 0.5426 | -0.0348 | |||
| GTES / Gates Industrial Corporation plc | 0.05 | -3.34 | 0.79 | 7.30 | 0.5169 | 0.0420 | |||
| TALO / Talos Energy Inc. | 0.08 | -3.34 | 0.78 | -17.74 | 0.5074 | -0.1001 | |||
| SON / Sonoco Products Company | 0.01 | -3.34 | 0.77 | 4.21 | 0.4998 | 0.0266 | |||
| LAKE / Lakeland Industries, Inc. | 0.03 | -3.34 | 0.70 | -15.29 | 0.4547 | -0.0745 | |||
| AZTA / Azenta, Inc. | 0.01 | -3.34 | 0.67 | -10.95 | 0.4341 | -0.0468 | |||
| LEA / Lear Corporation | 0.01 | -3.34 | 0.65 | -7.67 | 0.4235 | -0.0284 | |||
| CERT / Certara, Inc. | 0.04 | -3.34 | 0.52 | -18.30 | 0.3373 | -0.0696 | |||
| CCS / Century Communities, Inc. | 0.00 | -3.33 | 0.46 | 22.16 | 0.3014 | 0.0577 | |||
| AAP / Advance Auto Parts, Inc. | 0.01 | -3.34 | 0.46 | -40.60 | 0.2967 | -0.1948 | |||
| NWL / Newell Brands Inc. | 0.06 | -3.34 | 0.44 | 15.87 | 0.2853 | 0.0425 | |||
| GATX / GATX Corporation | 0.00 | -3.34 | 0.44 | -3.32 | 0.2848 | -0.0054 | |||
| CAG / Conagra Brands, Inc. | 0.01 | -3.34 | 0.40 | 10.64 | 0.2574 | 0.0280 | |||
| PTEN / Patterson-UTI Energy, Inc. | 0.05 | -3.34 | 0.37 | -28.54 | 0.2396 | -0.0913 | |||
| US7587501039 / Regal-Beloit Corp. | 0.00 | -3.35 | 0.37 | 18.71 | 0.2395 | 0.0404 | |||
| MEI / Methode Electronics, Inc. | 0.03 | -3.34 | 0.33 | 11.56 | 0.2140 | 0.0251 | |||
| LUNA / Luna Innovations Incorporated | 0.11 | -3.34 | 0.27 | -28.95 | 0.1725 | -0.0671 | |||
| SRI / Stoneridge, Inc. | 0.02 | -3.34 | 0.19 | -32.25 | 0.1220 | -0.0555 | |||
| Thermoenergy Corp. / EP (N/A) | 0.31 | 0.00 | 0.0001 | 0.0001 | |||||
| Thermoenergy Corp. / EP (N/A) | 0.31 | 0.00 | 0.0001 | 0.0001 | |||||
| US44887Q1085 / HydroGen Corp. | 0.67 | 0.00 | 0.00 | 0.0000 | 0.0000 |