Basic Stats
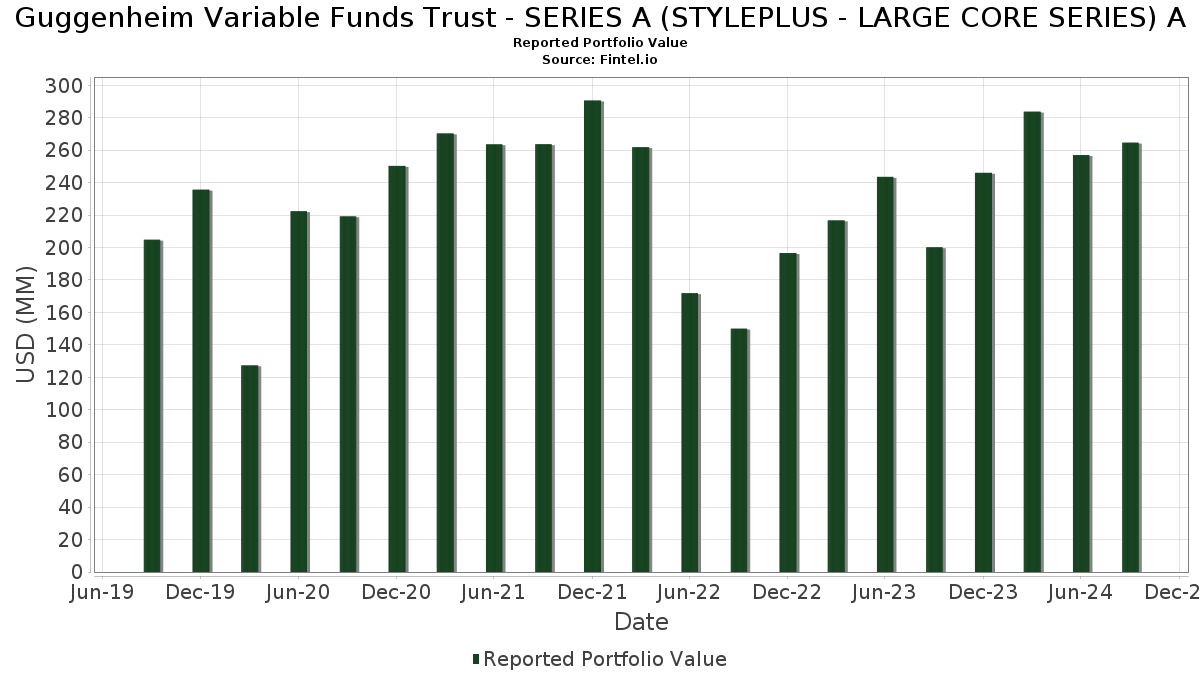
| Portfolio Value | $ 264,623,748 |
| Current Positions | 85 |
Latest Holdings, Performance, AUM (from 13F, 13D)
Guggenheim Variable Funds Trust - SERIES A (STYLEPLUS - LARGE CORE SERIES) A has disclosed 85 total holdings in their latest SEC filings. Most recent portfolio value is calculated to be $ 264,623,748 USD. Actual Assets Under Management (AUM) is this value plus cash (which is not disclosed). Guggenheim Variable Funds Trust - SERIES A (STYLEPLUS - LARGE CORE SERIES) A’s top holdings are Guggenheim Ultra Short Duration Fund - Institutional Class (US:US40169J5231) , Dreyfus Treasury Securities Cash Management - Dreyfus Treasury Securities Cash Management Institutional Shares (US:DIRXX) , Microsoft Corporation (US:MSFT) , Apple Inc. (US:AAPL) , and NVIDIA Corporation (US:NVDA) . Guggenheim Variable Funds Trust - SERIES A (STYLEPLUS - LARGE CORE SERIES) A’s new positions include Chubb Limited (US:CB) , GoDaddy Inc. (US:GDDY) , Duke Energy Corporation (US:DUK) , Citizens Financial Corp. (US:CIWV) , and .
Top Increases This Quarter
We use the change in the portfolio allocation because this is the most meaningful metric. Changes can be due to trades or changes in share prices.
| Security | Shares (MM) |
Value (MM$) |
Portfolio % | ΔPortfolio % |
|---|---|---|---|---|
| 2.49 | 62.01 | 24.2603 | 24.2603 | |
| 1.23 | 30.62 | 11.9787 | 11.9787 | |
| 10.51 | 4.1134 | 4.1134 | ||
| 11.32 | 11.32 | 4.4282 | 0.8867 | |
| 0.01 | 0.78 | 0.3034 | 0.3034 | |
| 0.00 | 0.73 | 0.2839 | 0.2839 | |
| 0.02 | 0.90 | 0.3516 | 0.2832 | |
| 0.01 | 0.71 | 0.2792 | 0.2792 | |
| 0.00 | 0.69 | 0.2687 | 0.2687 | |
| 0.00 | 0.68 | 0.2650 | 0.2650 |
Top Decreases This Quarter
We use the change in the portfolio allocation because this is the most meaningful metric. Changes can be due to trades or changes in share prices.
| Security | Shares (MM) |
Value (MM$) |
Portfolio % | ΔPortfolio % |
|---|---|---|---|---|
| 0.02 | 3.71 | 1.4512 | -0.2819 | |
| 0.01 | 4.26 | 1.6647 | -0.2031 | |
| 0.01 | 0.23 | 0.0908 | -0.1626 | |
| 0.00 | 0.20 | 0.0785 | -0.1470 | |
| 0.01 | 1.02 | 0.3972 | -0.1447 | |
| 2.42 | 60.12 | 23.5210 | -0.1222 | |
| 0.00 | 0.44 | 0.1730 | -0.1155 | |
| 0.00 | 0.00 | -0.1129 | ||
| 0.00 | 0.00 | -0.1039 | ||
| 0.00 | 0.55 | 0.2144 | -0.0909 |
13F and Fund Filings
This form was filed on 2024-11-29 for the reporting period 2024-09-30. Click the link icon to see the full transaction history.
Upgrade to unlock premium data and export to Excel ![]() .
.
| Security | Type | Avg Share Price | Shares (MM) |
ΔShares (%) |
ΔShares (%) |
Value ($MM) |
Portfolio (%) |
ΔPortfolio (%) |
|
|---|---|---|---|---|---|---|---|---|---|
| Guggenheim Strategy Fund III / EC (N/A) | 2.49 | 62.01 | 24.2603 | 24.2603 | |||||
| Guggenheim Variable Insurance Strategy Fund III / EC (N/A) | 2.42 | 1.39 | 60.12 | 2.04 | 23.5210 | -0.1222 | |||
| Guggenheim Strategy Fund II / EC (N/A) | 1.23 | 30.62 | 11.9787 | 11.9787 | |||||
| US40169J5231 / Guggenheim Ultra Short Duration Fund - Institutional Class | 2.94 | 1.31 | 29.42 | 2.12 | 11.5108 | -0.0507 | |||
| DIRXX / Dreyfus Treasury Securities Cash Management - Dreyfus Treasury Securities Cash Management Institutional Shares | 11.32 | 28.25 | 11.32 | 28.25 | 4.4282 | 0.8867 | |||
| S&P 500 Total Return Index / DE (N/A) | 10.51 | 4.1134 | 4.1134 | ||||||
| MSFT / Microsoft Corporation | 0.01 | -5.04 | 4.26 | -8.57 | 1.6647 | -0.2031 | |||
| AAPL / Apple Inc. | 0.02 | -22.36 | 3.71 | -14.10 | 1.4512 | -0.2819 | |||
| NVDA / NVIDIA Corporation | 0.03 | 10.06 | 3.56 | 8.18 | 1.3915 | 0.0723 | |||
| AMZN / Amazon.com, Inc. | 0.01 | 30.93 | 2.11 | 26.29 | 0.8251 | 0.1547 | |||
| GOOG / Alphabet Inc. | 0.01 | 16.16 | 1.95 | 5.91 | 0.7638 | 0.0239 | |||
| JNJ / Johnson & Johnson | 0.01 | 20.74 | 1.04 | 23.63 | 0.4075 | 0.0672 | |||
| ABBV / AbbVie Inc. | 0.01 | -0.56 | 1.02 | 14.51 | 0.3986 | 0.0415 | |||
| AVGO / Broadcom Inc. | 0.01 | 599.76 | 1.02 | -24.81 | 0.3972 | -0.1447 | |||
| CAT / Caterpillar Inc. | 0.00 | 2.02 | 0.93 | 19.72 | 0.3637 | 0.0523 | |||
| MRK / Merck & Co., Inc. | 0.01 | 9.31 | 0.91 | 0.22 | 0.3544 | -0.0082 | |||
| META / Meta Platforms, Inc. | 0.00 | 5.94 | 0.90 | 20.21 | 0.3516 | 0.0517 | |||
| BAC / Bank of America Corporation | 0.02 | 407.48 | 0.90 | 431.36 | 0.3516 | 0.2832 | |||
| IBM / International Business Machines Corporation | 0.00 | -10.56 | 0.88 | 14.34 | 0.3435 | 0.0353 | |||
| QCOM / QUALCOMM Incorporated | 0.00 | 25.37 | 0.84 | 6.99 | 0.3297 | 0.0138 | |||
| CSCO / Cisco Systems, Inc. | 0.02 | -8.28 | 0.84 | 2.83 | 0.3272 | 0.0006 | |||
| AXP / American Express Company | 0.00 | 117.00 | 0.82 | 154.21 | 0.3196 | 0.1906 | |||
| WFC / Wells Fargo & Company | 0.01 | 0.20 | 0.78 | -2.39 | 0.3042 | -0.0175 | |||
| RTX / RTX Corporation | 0.01 | 0.78 | 0.3034 | 0.3034 | |||||
| T / AT&T Inc. | 0.04 | 330.53 | 0.77 | 353.53 | 0.3017 | 0.2173 | |||
| AMAT / Applied Materials, Inc. | 0.00 | 7.41 | 0.75 | -8.07 | 0.2945 | -0.0340 | |||
| LMT / Lockheed Martin Corporation | 0.00 | -11.32 | 0.75 | 11.09 | 0.2939 | 0.0223 | |||
| GILD / Gilead Sciences, Inc. | 0.01 | -11.64 | 0.75 | 8.07 | 0.2934 | 0.0147 | |||
| URI / United Rentals, Inc. | 0.00 | -2.42 | 0.75 | 22.19 | 0.2933 | 0.0471 | |||
| BMY / Bristol-Myers Squibb Company | 0.01 | -10.58 | 0.73 | 11.40 | 0.2872 | 0.0228 | |||
| CB / Chubb Limited | 0.00 | 0.73 | 0.2839 | 0.2839 | |||||
| APH / Amphenol Corporation | 0.01 | 0.71 | 0.2792 | 0.2792 | |||||
| GWW / W.W. Grainger, Inc. | 0.00 | 0.00 | 0.70 | 15.18 | 0.2731 | 0.0298 | |||
| HCA / HCA Healthcare, Inc. | 0.00 | 69.73 | 0.70 | 115.12 | 0.2729 | 0.1425 | |||
| MSI / Motorola Solutions, Inc. | 0.00 | -9.57 | 0.69 | 5.33 | 0.2711 | 0.0071 | |||
| CMI / Cummins Inc. | 0.00 | -0.47 | 0.69 | 16.39 | 0.2698 | 0.0320 | |||
| WAB / Westinghouse Air Brake Technologies Corporation | 0.00 | 0.69 | 0.2687 | 0.2687 | |||||
| PCAR / PACCAR Inc | 0.01 | 22.05 | 0.68 | 16.95 | 0.2675 | 0.0330 | |||
| EBAY / eBay Inc. | 0.01 | -5.10 | 0.68 | 15.11 | 0.2653 | 0.0287 | |||
| AMP / Ameriprise Financial, Inc. | 0.00 | 0.68 | 0.2650 | 0.2650 | |||||
| REGN / Regeneron Pharmaceuticals, Inc. | 0.00 | -6.25 | 0.66 | -6.23 | 0.2591 | -0.0243 | |||
| NXPI / NXP Semiconductors N.V. | 0.00 | 18.01 | 0.66 | 5.25 | 0.2590 | 0.0066 | |||
| TE Connectivity plc / EC (IE000IVNQZ81) | 0.00 | 0.65 | 0.2551 | 0.2551 | |||||
| FFIV / F5, Inc. | 0.00 | -12.22 | 0.65 | 12.24 | 0.2550 | 0.0219 | |||
| MAS / Masco Corporation | 0.01 | -8.44 | 0.65 | 15.25 | 0.2545 | 0.0281 | |||
| HIG / The Hartford Insurance Group, Inc. | 0.01 | -7.34 | 0.64 | 8.50 | 0.2497 | 0.0134 | |||
| HPQ / HP Inc. | 0.02 | 78.46 | 0.64 | 82.76 | 0.2491 | 0.1093 | |||
| ALLE / Allegion plc | 0.00 | -8.62 | 0.64 | 12.77 | 0.2490 | 0.0224 | |||
| INCY / Incyte Corporation | 0.01 | 3.63 | 0.64 | 20.27 | 0.2486 | 0.0351 | |||
| ACGL / Arch Capital Group Ltd. | 0.01 | 96.58 | 0.63 | 118.34 | 0.2469 | 0.1307 | |||
| FITB / Fifth Third Bancorp | 0.01 | -8.72 | 0.63 | 7.20 | 0.2448 | 0.0105 | |||
| GEN / Gen Digital Inc. | 0.02 | 166.45 | 0.62 | 294.30 | 0.2438 | 0.1716 | |||
| GDDY / GoDaddy Inc. | 0.00 | 0.61 | 0.2391 | 0.2391 | |||||
| HOLX / Hologic, Inc. | 0.01 | 0.61 | 0.2389 | 0.2389 | |||||
| DOV / Dover Corporation | 0.00 | -1.85 | 0.61 | 4.29 | 0.2382 | 0.0039 | |||
| LLY / Eli Lilly and Company | 0.00 | 117.83 | 0.61 | 113.03 | 0.2371 | 0.1230 | |||
| EG / Everest Group, Ltd. | 0.00 | 2.93 | 0.61 | 5.95 | 0.2368 | 0.0073 | |||
| AKAM / Akamai Technologies, Inc. | 0.01 | 178.49 | 0.60 | 212.95 | 0.2367 | 0.1589 | |||
| TDG / TransDigm Group Incorporated | 0.00 | 239.02 | 0.60 | 278.98 | 0.2328 | 0.1698 | |||
| NTAP / NetApp, Inc. | 0.00 | -1.59 | 0.58 | -5.55 | 0.2267 | -0.0197 | |||
| UHS / Universal Health Services, Inc. | 0.00 | 0.58 | 0.2262 | 0.2262 | |||||
| SNA / Snap-on Incorporated | 0.00 | -6.90 | 0.57 | 3.07 | 0.2233 | 0.0013 | |||
| BRK.B / Berkshire Hathaway Inc. | 0.00 | 29.74 | 0.56 | 46.88 | 0.2208 | 0.0665 | |||
| AMGN / Amgen Inc. | 0.00 | -30.14 | 0.55 | -27.89 | 0.2144 | -0.0909 | |||
| PHM / PulteGroup, Inc. | 0.00 | -25.61 | 0.55 | -3.02 | 0.2138 | -0.0123 | |||
| GRMN / Garmin Ltd. | 0.00 | 175.00 | 0.54 | 198.34 | 0.2114 | 0.1384 | |||
| FICO / Fair Isaac Corporation | 0.00 | -6.94 | 0.52 | 21.50 | 0.2038 | 0.0317 | |||
| SWKS / Skyworks Solutions, Inc. | 0.01 | -15.77 | 0.52 | -21.95 | 0.2033 | -0.0638 | |||
| SYF / Synchrony Financial | 0.01 | -25.73 | 0.49 | -21.50 | 0.1929 | -0.0591 | |||
| QRVO / Qorvo, Inc. | 0.00 | -19.99 | 0.47 | -28.74 | 0.1844 | -0.0811 | |||
| KLAC / KLA Corporation | 0.00 | -34.52 | 0.44 | -38.44 | 0.1730 | -0.1155 | |||
| DUK / Duke Energy Corporation | 0.00 | 0.41 | 0.1589 | 0.1589 | |||||
| ANET / Arista Networks Inc | 0.00 | -14.77 | 0.39 | 127.65 | 0.1517 | 0.0886 | |||
| HON / Honeywell International Inc. | 0.00 | 0.38 | 0.1487 | 0.1487 | |||||
| LEN / Lennar Corporation | 0.00 | -48.96 | 0.36 | -36.20 | 0.1422 | -0.0863 | |||
| CIWV / Citizens Financial Corp. | 0.01 | 0.28 | 0.1083 | 0.1083 | |||||
| DVA / DaVita Inc. | 0.00 | -52.61 | 0.26 | -43.82 | 0.1013 | -0.0841 | |||
| RL / Ralph Lauren Corporation | 0.00 | 0.25 | 0.0967 | 0.0967 | |||||
| GM / General Motors Company | 0.01 | -61.93 | 0.23 | -63.23 | 0.0908 | -0.1626 | |||
| JPM / JPMorgan Chase & Co. | 0.00 | 6.84 | 0.20 | 11.11 | 0.0786 | 0.0062 | |||
| AOS / A. O. Smith Corporation | 0.00 | -67.51 | 0.20 | -64.35 | 0.0785 | -0.1470 | |||
| TSLA / Tesla, Inc. | 0.00 | -21.59 | 0.19 | 3.76 | 0.0758 | 0.0008 | |||
| XOM / Exxon Mobil Corporation | 0.00 | 3.60 | 0.18 | 5.33 | 0.0700 | 0.0019 | |||
| UNH / UnitedHealth Group Incorporated | 0.00 | -11.25 | 0.17 | 1.80 | 0.0668 | -0.0004 | |||
| S&P 500 Index Mini Futures Contracts / DE (N/A) | 0.13 | 0.0489 | 0.0489 | ||||||
| NRG / NRG Energy, Inc. | 0.00 | -100.00 | 0.00 | -100.00 | -0.1039 | ||||
| AIG / American International Group, Inc. | 0.00 | -100.00 | 0.00 | -100.00 | -0.1129 |