Basic Stats
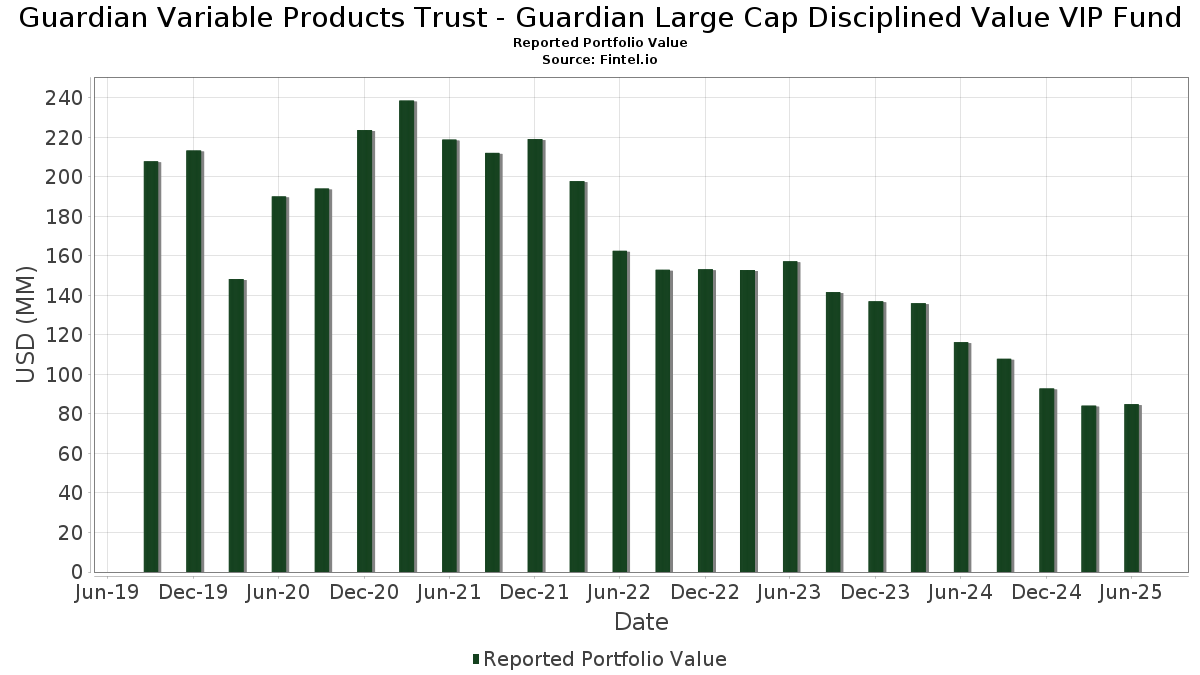
| Portfolio Value | $ 84,941,617 |
| Current Positions | 87 |
Latest Holdings, Performance, AUM (from 13F, 13D)
Guardian Variable Products Trust - Guardian Large Cap Disciplined Value VIP Fund has disclosed 87 total holdings in their latest SEC filings. Most recent portfolio value is calculated to be $ 84,941,617 USD. Actual Assets Under Management (AUM) is this value plus cash (which is not disclosed). Guardian Variable Products Trust - Guardian Large Cap Disciplined Value VIP Fund’s top holdings are JPMorgan Chase & Co. (US:JPM) , Philip Morris International Inc. (US:PM) , Uber Technologies, Inc. (US:UBER) , US Foods Holding Corp. (US:USFD) , and Honeywell International Inc. (US:HON) . Guardian Variable Products Trust - Guardian Large Cap Disciplined Value VIP Fund’s new positions include Amazon.com, Inc. (US:AMZN) , L3Harris Technologies, Inc. (US:LHX) , Entergy Corporation (US:ETR) , Reliance, Inc. (US:RS) , and Hubbell Incorporated (US:HUBB) .
Top Increases This Quarter
We use the change in the portfolio allocation because this is the most meaningful metric. Changes can be due to trades or changes in share prices.
| Security | Shares (MM) |
Value (MM$) |
Portfolio % | ΔPortfolio % |
|---|---|---|---|---|
| 0.01 | 1.29 | 1.5126 | 1.5126 | |
| 0.00 | 0.97 | 1.1435 | 1.1435 | |
| 0.00 | 0.78 | 0.9150 | 0.9150 | |
| 0.01 | 0.78 | 0.9146 | 0.9146 | |
| 0.02 | 1.39 | 1.6310 | 0.8999 | |
| 0.01 | 1.59 | 1.8679 | 0.8093 | |
| 0.01 | 1.63 | 1.9189 | 0.6318 | |
| 0.00 | 0.54 | 0.6296 | 0.6296 | |
| 0.00 | 0.53 | 0.6188 | 0.6188 | |
| 0.00 | 1.06 | 1.2523 | 0.6132 |
Top Decreases This Quarter
We use the change in the portfolio allocation because this is the most meaningful metric. Changes can be due to trades or changes in share prices.
| Security | Shares (MM) |
Value (MM$) |
Portfolio % | ΔPortfolio % |
|---|---|---|---|---|
| 0.00 | 0.91 | 1.0742 | -1.6018 | |
| 0.01 | 1.53 | 1.7949 | -1.0502 | |
| 0.02 | 0.51 | 0.5996 | -0.9416 | |
| 0.03 | 0.54 | 0.6295 | -0.8546 | |
| 0.01 | 1.32 | 1.5573 | -0.7878 | |
| 0.01 | 0.23 | 0.2764 | -0.5399 | |
| 0.01 | 0.42 | 0.4994 | -0.5365 | |
| 0.00 | 0.49 | 0.5709 | -0.5015 | |
| 0.01 | 0.45 | 0.5336 | -0.3278 | |
| 0.01 | 1.15 | 1.3475 | -0.3228 |
13F and Fund Filings
This form was filed on 2025-08-15 for the reporting period 2025-06-30. Click the link icon to see the full transaction history.
Upgrade to unlock premium data and export to Excel ![]() .
.
| Security | Type | Avg Share Price | Shares (MM) |
ΔShares (%) |
ΔShares (%) |
Value ($MM) |
Portfolio (%) |
ΔPortfolio (%) |
|
|---|---|---|---|---|---|---|---|---|---|
| JPM / JPMorgan Chase & Co. | 0.01 | -5.68 | 3.80 | 11.47 | 4.4707 | 0.4237 | |||
| PM / Philip Morris International Inc. | 0.01 | -5.27 | 2.53 | 8.70 | 2.9706 | 0.2126 | |||
| UBER / Uber Technologies, Inc. | 0.02 | -5.28 | 1.72 | 21.37 | 2.0175 | 0.3391 | |||
| USFD / US Foods Holding Corp. | 0.02 | -5.68 | 1.68 | 11.00 | 1.9708 | 0.1786 | |||
| HON / Honeywell International Inc. | 0.01 | -5.27 | 1.64 | 4.20 | 1.9264 | 0.0605 | |||
| ORCL / Oracle Corporation | 0.01 | -3.79 | 1.63 | 50.46 | 1.9189 | 0.6318 | |||
| COR / Cencora, Inc. | 0.01 | -16.63 | 1.60 | -10.09 | 1.8765 | -0.2299 | |||
| DIS / The Walt Disney Company | 0.01 | 41.72 | 1.59 | 78.11 | 1.8679 | 0.8093 | |||
| CRH / CRH plc | 0.02 | 5.22 | 1.56 | 9.85 | 1.8366 | 0.1487 | |||
| ABBV / AbbVie Inc. | 0.01 | -28.14 | 1.53 | -36.35 | 1.7949 | -1.0502 | |||
| AXP / American Express Company | 0.00 | 0.71 | 1.50 | 19.38 | 1.7621 | 0.2728 | |||
| LPLA / LPL Financial Holdings Inc. | 0.00 | -2.35 | 1.49 | 11.92 | 1.7573 | 0.1729 | |||
| KGC / Kinross Gold Corporation | 0.10 | -5.39 | 1.49 | 17.30 | 1.7555 | 0.2449 | |||
| KO / The Coca-Cola Company | 0.02 | -5.27 | 1.43 | -6.43 | 1.6785 | -0.1315 | |||
| SYY / Sysco Corporation | 0.02 | -13.21 | 1.42 | -12.42 | 1.6684 | -0.2536 | |||
| MCK / McKesson Corporation | 0.00 | -17.91 | 1.41 | -10.63 | 1.6628 | -0.2146 | |||
| FIS / Fidelity National Information Services, Inc. | 0.02 | 11.17 | 1.39 | 21.22 | 1.6405 | 0.2745 | |||
| MCHP / Microchip Technology Incorporated | 0.02 | 54.87 | 1.39 | 125.37 | 1.6310 | 0.8999 | |||
| MPC / Marathon Petroleum Corporation | 0.01 | 5.41 | 1.38 | 20.23 | 1.6223 | 0.2601 | |||
| GOOGL / Alphabet Inc. | 0.01 | -41.20 | 1.32 | -33.01 | 1.5573 | -0.7878 | |||
| AZO / AutoZone, Inc. | 0.00 | -5.16 | 1.30 | -7.70 | 1.5241 | -0.1416 | |||
| WFC / Wells Fargo & Company | 0.02 | -5.27 | 1.29 | 5.72 | 1.5234 | 0.0692 | |||
| AMZN / Amazon.com, Inc. | 0.01 | 1.29 | 1.5126 | 1.5126 | |||||
| FLEX / Flex Ltd. | 0.03 | -8.72 | 1.25 | 37.75 | 1.4689 | 0.3928 | |||
| HBAN / Huntington Bancshares Incorporated | 0.07 | -5.27 | 1.21 | 5.77 | 1.4244 | 0.0654 | |||
| MS / Morgan Stanley | 0.01 | -5.26 | 1.20 | 14.35 | 1.4163 | 0.1667 | |||
| FANG / Diamondback Energy, Inc. | 0.01 | -5.27 | 1.15 | -18.62 | 1.3475 | -0.3228 | |||
| CPAY / Corpay, Inc. | 0.00 | -5.27 | 1.11 | -9.87 | 1.3115 | -0.1568 | |||
| FE / FirstEnergy Corp. | 0.03 | -7.45 | 1.11 | -7.81 | 1.3063 | -0.1237 | |||
| DELL / Dell Technologies Inc. | 0.01 | -5.28 | 1.08 | 27.36 | 1.2716 | 0.2644 | |||
| COP / ConocoPhillips | 0.01 | -5.27 | 1.08 | -19.07 | 1.2686 | -0.3129 | |||
| PPL / PPL Corporation | 0.03 | -5.54 | 1.08 | -11.30 | 1.2648 | -0.1749 | |||
| URI / United Rentals, Inc. | 0.00 | 64.49 | 1.06 | 97.77 | 1.2523 | 0.6132 | |||
| AON / Aon plc | 0.00 | -5.36 | 1.06 | -15.43 | 1.2515 | -0.2413 | |||
| NSC / Norfolk Southern Corporation | 0.00 | -20.91 | 1.06 | -14.49 | 1.2493 | -0.2257 | |||
| NXPI / NXP Semiconductors N.V. | 0.00 | 64.55 | 1.04 | 89.11 | 1.2265 | 0.5722 | |||
| MU / Micron Technology, Inc. | 0.01 | -18.82 | 1.03 | 15.08 | 1.2127 | 0.1500 | |||
| AMAT / Applied Materials, Inc. | 0.01 | 15.06 | 1.02 | 45.09 | 1.2008 | 0.3660 | |||
| GD / General Dynamics Corporation | 0.00 | 3.45 | 1.01 | 10.71 | 1.1919 | 0.1053 | |||
| ALL / The Allstate Corporation | 0.00 | -6.09 | 0.98 | -8.66 | 1.1545 | -0.1215 | |||
| COF / Capital One Financial Corporation | 0.00 | 0.97 | 1.1435 | 1.1435 | |||||
| KEYS / Keysight Technologies, Inc. | 0.01 | 15.64 | 0.97 | 26.43 | 1.1433 | 0.2314 | |||
| MDT / Medtronic plc | 0.01 | 14.10 | 0.93 | 10.71 | 1.0942 | 0.0966 | |||
| UNH / UnitedHealth Group Incorporated | 0.00 | -31.99 | 0.91 | -59.49 | 1.0742 | -1.6018 | |||
| DGX / Quest Diagnostics Incorporated | 0.01 | 46.40 | 0.90 | 55.61 | 1.0601 | 0.3718 | |||
| CNP / CenterPoint Energy, Inc. | 0.02 | -14.69 | 0.90 | -13.50 | 1.0563 | -0.1759 | |||
| SCHW / The Charles Schwab Corporation | 0.01 | -19.08 | 0.87 | -5.64 | 1.0239 | -0.0717 | |||
| WAB / Westinghouse Air Brake Technologies Corporation | 0.00 | 5.49 | 0.86 | 21.76 | 1.0077 | 0.1727 | |||
| J / Jacobs Solutions Inc. | 0.01 | -5.27 | 0.85 | 2.92 | 0.9975 | 0.0203 | |||
| BKNG / Booking Holdings Inc. | 0.00 | 22.03 | 0.83 | 53.41 | 0.9807 | 0.3354 | |||
| TMUS / T-Mobile US, Inc. | 0.00 | 5.25 | 0.81 | -6.03 | 0.9552 | -0.0700 | |||
| AZN / AstraZeneca PLC - Depositary Receipt (Common Stock) | 0.01 | -5.28 | 0.80 | -10.00 | 0.9429 | -0.1136 | |||
| GS / The Goldman Sachs Group, Inc. | 0.00 | -5.31 | 0.79 | 22.72 | 0.9350 | 0.1659 | |||
| LHX / L3Harris Technologies, Inc. | 0.00 | 0.78 | 0.9150 | 0.9150 | |||||
| ETR / Entergy Corporation | 0.01 | 0.78 | 0.9146 | 0.9146 | |||||
| AN / AutoNation, Inc. | 0.00 | -17.26 | 0.77 | 1.46 | 0.9016 | 0.0053 | |||
| OKE / ONEOK, Inc. | 0.01 | 47.44 | 0.74 | 21.41 | 0.8744 | 0.1470 | |||
| TRMB / Trimble Inc. | 0.01 | 8.45 | 0.71 | 25.53 | 0.8393 | 0.1645 | |||
| HD / The Home Depot, Inc. | 0.00 | -5.25 | 0.65 | -5.22 | 0.7699 | -0.0498 | |||
| EMR / Emerson Electric Co. | 0.00 | -36.95 | 0.65 | -23.31 | 0.7629 | -0.2412 | |||
| CHRW / C.H. Robinson Worldwide, Inc. | 0.01 | 62.47 | 0.63 | 52.29 | 0.7442 | 0.2509 | |||
| ELV / Elevance Health, Inc. | 0.00 | 9.27 | 0.62 | -2.21 | 0.7284 | -0.0239 | |||
| NEM / Newmont Corporation | 0.01 | -44.60 | 0.62 | -47.94 | 0.7272 | 0.1853 | |||
| CCEP / COCA COLA EUROPACIFIC COMPANY GUAR REGS 11/27 1.5 | 0.01 | -5.27 | 0.59 | 0.85 | 0.6983 | 0.0001 | |||
| TECK / Teck Resources Limited | 0.01 | -5.28 | 0.56 | 5.05 | 0.6618 | 0.0257 | |||
| CVE / Cenovus Energy Inc. | 0.04 | -5.28 | 0.55 | -7.38 | 0.6496 | -0.0582 | |||
| LDOS / Leidos Holdings, Inc. | 0.00 | 3.06 | 0.54 | 20.44 | 0.6382 | 0.1037 | |||
| RS / Reliance, Inc. | 0.00 | 0.54 | 0.6296 | 0.6296 | |||||
| KVUE / Kenvue Inc. | 0.03 | -50.96 | 0.54 | -57.20 | 0.6295 | -0.8546 | |||
| AJG / Arthur J. Gallagher & Co. | 0.00 | -5.40 | 0.53 | -12.31 | 0.6206 | -0.0933 | |||
| HUBB / Hubbell Incorporated | 0.00 | 0.53 | 0.6188 | 0.6188 | |||||
| SLB / Schlumberger Limited | 0.02 | -51.45 | 0.51 | -60.79 | 0.5996 | -0.9416 | |||
| ICE / Intercontinental Exchange, Inc. | 0.00 | -5.24 | 0.51 | 0.80 | 0.5968 | -0.0008 | |||
| Aptiv PLC / EC (JE00BTDN8H13) | 0.01 | 0.50 | 0.5928 | 0.5928 | |||||
| APO / Apollo Global Management, Inc. | 0.00 | -48.14 | 0.49 | -46.29 | 0.5709 | -0.5015 | |||
| FTV / Fortive Corporation | 0.01 | -12.25 | 0.45 | -37.52 | 0.5336 | -0.3278 | |||
| CB / Chubb Limited | 0.00 | -5.27 | 0.45 | -9.24 | 0.5327 | -0.0588 | |||
| KBR / KBR, Inc. | 0.01 | 3.10 | 0.44 | -0.68 | 0.5180 | -0.0088 | |||
| ALLE / Allegion plc | 0.00 | -5.38 | 0.44 | 4.53 | 0.5162 | 0.0179 | |||
| FIXED INC CLEARING CORP.REPO / RA (000000000) | 0.42 | 0.4998 | 0.4998 | ||||||
| OMC / Omnicom Group Inc. | 0.01 | -43.93 | 0.42 | -51.38 | 0.4994 | -0.5365 | |||
| UAL / United Airlines Holdings, Inc. | 0.01 | -22.17 | 0.42 | -10.37 | 0.4893 | -0.0608 | |||
| CNQ / Canadian Natural Resources Limited | 0.01 | -28.45 | 0.39 | -27.09 | 0.4631 | -0.1776 | |||
| CNC / Centene Corporation | 0.01 | -5.27 | 0.29 | -15.32 | 0.3456 | -0.0662 | |||
| OWL / Blue Owl Capital Inc. | 0.01 | -64.35 | 0.23 | -65.94 | 0.2764 | -0.5399 | |||
| FLS / Flowserve Corporation | 0.00 | 0.19 | 0.2180 | 0.2180 | |||||
| RAL / Ralliant Corporation | 0.00 | 0.14 | 0.1654 | 0.1654 |