Basic Stats
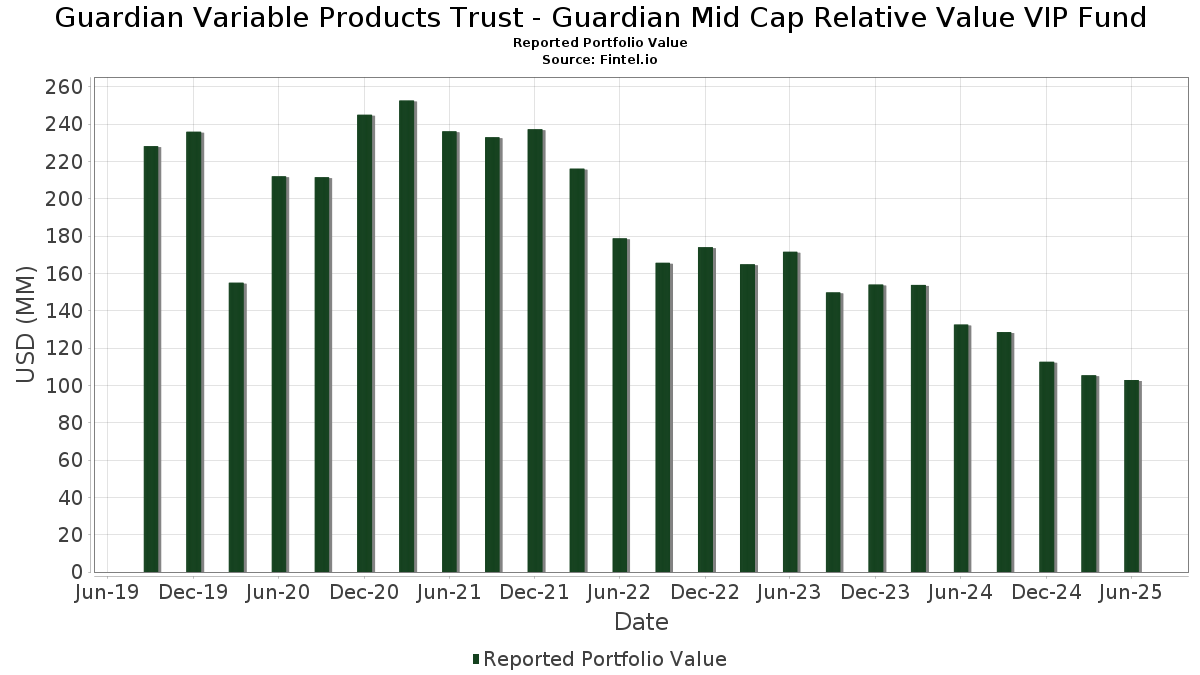
| Portfolio Value | $ 102,863,746 |
| Current Positions | 66 |
Latest Holdings, Performance, AUM (from 13F, 13D)
Guardian Variable Products Trust - Guardian Mid Cap Relative Value VIP Fund has disclosed 66 total holdings in their latest SEC filings. Most recent portfolio value is calculated to be $ 102,863,746 USD. Actual Assets Under Management (AUM) is this value plus cash (which is not disclosed). Guardian Variable Products Trust - Guardian Mid Cap Relative Value VIP Fund’s top holdings are Keurig Dr Pepper Inc. (US:KDP) , AerCap Holdings N.V. (US:AER) , American Electric Power Company, Inc. (US:AEP) , CBRE Group, Inc. (US:CBRE) , and Labcorp Holdings Inc. (US:LH) . Guardian Variable Products Trust - Guardian Mid Cap Relative Value VIP Fund’s new positions include Somnigroup International Inc. (US:SGI) , Ingersoll Rand Inc. (US:IR) , TopBuild Corp. (US:BLD) , Hologic, Inc. (US:HOLX) , and Nucor Corporation (US:NUE) .
Top Increases This Quarter
We use the change in the portfolio allocation because this is the most meaningful metric. Changes can be due to trades or changes in share prices.
| Security | Shares (MM) |
Value (MM$) |
Portfolio % | ΔPortfolio % |
|---|---|---|---|---|
| 0.06 | 1.79 | 1.7343 | 1.3869 | |
| 1.16 | 1.1232 | 1.1232 | ||
| 0.02 | 1.02 | 0.9944 | 0.9944 | |
| 0.01 | 0.88 | 0.8529 | 0.8529 | |
| 0.01 | 1.93 | 1.8726 | 0.6911 | |
| 0.01 | 1.09 | 1.0582 | 0.6860 | |
| 0.00 | 0.67 | 0.6469 | 0.6469 | |
| 0.01 | 0.62 | 0.6000 | 0.6000 | |
| 0.01 | 1.88 | 1.8217 | 0.5927 | |
| 0.03 | 1.74 | 1.6864 | 0.5755 |
Top Decreases This Quarter
We use the change in the portfolio allocation because this is the most meaningful metric. Changes can be due to trades or changes in share prices.
| Security | Shares (MM) |
Value (MM$) |
Portfolio % | ΔPortfolio % |
|---|---|---|---|---|
| 0.03 | 0.64 | 0.6180 | -1.3434 | |
| 0.01 | 1.63 | 1.5813 | -1.2201 | |
| 0.01 | 2.17 | 2.1108 | -0.8935 | |
| 0.03 | 2.58 | 2.5027 | -0.6252 | |
| 0.02 | 2.45 | 2.3805 | -0.6184 | |
| 0.03 | 3.01 | 2.9262 | -0.5825 | |
| 0.12 | 2.44 | 2.3686 | -0.3664 | |
| 0.03 | 1.49 | 1.4494 | -0.3419 | |
| 0.02 | 1.78 | 1.7325 | -0.2880 | |
| 0.11 | 2.15 | 2.0852 | -0.2544 |
13F and Fund Filings
This form was filed on 2025-08-15 for the reporting period 2025-06-30. Click the link icon to see the full transaction history.
Upgrade to unlock premium data and export to Excel ![]() .
.
| Security | Type | Avg Share Price | Shares (MM) |
ΔShares (%) |
ΔShares (%) |
Value ($MM) |
Portfolio (%) |
ΔPortfolio (%) |
|
|---|---|---|---|---|---|---|---|---|---|
| KDP / Keurig Dr Pepper Inc. | 0.09 | -5.63 | 3.03 | -8.81 | 2.9444 | -0.2075 | |||
| AER / AerCap Holdings N.V. | 0.03 | -28.93 | 3.01 | -18.62 | 2.9262 | -0.5825 | |||
| AEP / American Electric Power Company, Inc. | 0.03 | -3.23 | 2.99 | -8.10 | 2.8996 | -0.1798 | |||
| CBRE / CBRE Group, Inc. | 0.02 | 2.45 | 2.96 | 9.77 | 2.8714 | 0.3185 | |||
| LH / Labcorp Holdings Inc. | 0.01 | -6.10 | 2.83 | 5.92 | 2.7455 | 0.2157 | |||
| CSL / Carlisle Companies Incorporated | 0.01 | 7.55 | 2.66 | 17.93 | 2.5887 | 0.4466 | |||
| ACGL / Arch Capital Group Ltd. | 0.03 | -17.51 | 2.58 | -21.92 | 2.5027 | -0.6252 | |||
| VMC / Vulcan Materials Company | 0.01 | 1.52 | 2.51 | 13.47 | 2.4388 | 0.3417 | |||
| JEF / Jefferies Financial Group Inc. | 0.05 | 2.45 | 2.48 | 4.59 | 2.4134 | 0.1614 | |||
| FE / FirstEnergy Corp. | 0.06 | 0.00 | 2.47 | -0.40 | 2.4032 | 0.0485 | |||
| BRO / Brown & Brown, Inc. | 0.02 | -13.08 | 2.45 | -22.54 | 2.3805 | -0.6184 | |||
| GPK / Graphic Packaging Holding Company | 0.12 | 4.13 | 2.44 | -15.49 | 2.3686 | -0.3664 | |||
| LHX / L3Harris Technologies, Inc. | 0.01 | -42.78 | 2.17 | -31.43 | 2.1108 | -0.8935 | |||
| FITB / Fifth Third Bancorp | 0.05 | 1.70 | 2.17 | 6.74 | 2.1072 | 0.1800 | |||
| CRL / Charles River Laboratories International, Inc. | 0.01 | 12.64 | 2.17 | 13.57 | 2.1062 | 0.2960 | |||
| J / Jacobs Solutions Inc. | 0.02 | -6.22 | 2.16 | 1.94 | 2.0961 | 0.0901 | |||
| CP / Canadian Pacific Kansas City Limited | 0.03 | 10.90 | 2.15 | 25.25 | 2.0917 | 0.4614 | |||
| NLY / Annaly Capital Management, Inc. | 0.11 | -6.13 | 2.15 | -13.01 | 2.0852 | -0.2544 | |||
| AWK / American Water Works Company, Inc. | 0.01 | -5.39 | 1.96 | -10.75 | 1.9030 | -0.1786 | |||
| WCC / WESCO International, Inc. | 0.01 | 29.71 | 1.93 | 54.65 | 1.8726 | 0.6911 | |||
| DOX / Amdocs Limited | 0.02 | 0.00 | 1.92 | -0.31 | 1.8695 | 0.0398 | |||
| DHI / D.R. Horton, Inc. | 0.01 | 42.65 | 1.88 | 44.68 | 1.8217 | 0.5927 | |||
| TER / Teradyne, Inc. | 0.02 | 21.05 | 1.86 | 31.82 | 1.8030 | 0.4678 | |||
| BXP / Boston Properties, Inc. | 0.03 | -6.18 | 1.79 | -5.79 | 1.7406 | -0.0624 | |||
| SARO / StandardAero, Inc. | 0.06 | 310.08 | 1.79 | 387.70 | 1.7343 | 1.3869 | |||
| CHD / Church & Dwight Co., Inc. | 0.02 | -4.15 | 1.78 | -16.33 | 1.7325 | -0.2880 | |||
| EQT / EQT Corporation | 0.03 | 0.37 | 1.77 | 9.51 | 1.7232 | 0.1882 | |||
| L / Loews Corporation | 0.02 | -9.03 | 1.74 | -9.26 | 1.6944 | -0.1283 | |||
| ON / ON Semiconductor Corporation | 0.03 | 15.03 | 1.74 | 48.25 | 1.6864 | 0.5755 | |||
| GTES / Gates Industrial Corporation plc | 0.07 | -8.39 | 1.72 | 14.61 | 1.6692 | 0.2477 | |||
| WY / Weyerhaeuser Company | 0.06 | 9.29 | 1.66 | -4.11 | 1.6085 | -0.0286 | |||
| RSG / Republic Services, Inc. | 0.01 | -45.91 | 1.63 | -44.94 | 1.5813 | -1.2201 | |||
| BKR / Baker Hughes Company | 0.04 | 17.35 | 1.57 | 2.34 | 1.5279 | 0.0713 | |||
| EEFT / Euronet Worldwide, Inc. | 0.02 | -5.52 | 1.56 | -10.33 | 1.5176 | -0.1346 | |||
| GLPI / Gaming and Leisure Properties, Inc. | 0.03 | -13.89 | 1.49 | -21.02 | 1.4494 | -0.3419 | |||
| EOG / EOG Resources, Inc. | 0.01 | -5.18 | 1.46 | -11.58 | 1.4167 | -0.1466 | |||
| ALC / Alcon Inc. | 0.02 | -5.99 | 1.43 | -12.58 | 1.3918 | -0.1620 | |||
| FCX / Freeport-McMoRan Inc. | 0.03 | 1.74 | 1.38 | 16.51 | 1.3371 | 0.2170 | |||
| RF / Regions Financial Corporation | 0.05 | -3.03 | 1.29 | 4.98 | 1.2503 | 0.0878 | |||
| CUBE / CubeSmart | 0.03 | -5.64 | 1.27 | -6.07 | 1.2317 | -0.0484 | |||
| VLO / Valero Energy Corporation | 0.01 | 9.07 | 1.25 | 10.97 | 1.2188 | 0.1473 | |||
| Aptiv PLC / EC (JE00BTDN8H13) | 0.02 | -1.97 | 1.22 | 12.45 | 1.1841 | 0.1560 | |||
| RPM / RPM International Inc. | 0.01 | 29.59 | 1.18 | 23.08 | 1.1504 | 0.2380 | |||
| FIXED INC CLEARING CORP.REPO / RA (000000000) | 1.16 | 1.1232 | 1.1232 | ||||||
| HUM / Humana Inc. | 0.00 | 0.00 | 1.10 | -7.63 | 1.0701 | -0.0602 | |||
| BAH / Booz Allen Hamilton Holding Corporation | 0.01 | 178.62 | 1.09 | 177.81 | 1.0582 | 0.6860 | |||
| KNX / Knight-Swift Transportation Holdings Inc. | 0.02 | 2.67 | 1.03 | 4.46 | 1.0008 | 0.0654 | |||
| SGI / Somnigroup International Inc. | 0.02 | 1.02 | 0.9944 | 0.9944 | |||||
| APG / APi Group Corporation | 0.02 | -39.50 | 1.02 | -13.62 | 0.9925 | -0.1289 | |||
| ICLR / ICON Public Limited Company | 0.01 | 34.29 | 0.99 | 11.60 | 0.9634 | 0.1210 | |||
| CSX / CSX Corporation | 0.03 | 2.72 | 0.93 | 13.85 | 0.9032 | 0.1292 | |||
| PVH / PVH Corp. | 0.01 | 149.77 | 0.92 | 165.61 | 0.8929 | 0.5642 | |||
| IR / Ingersoll Rand Inc. | 0.01 | 0.88 | 0.8529 | 0.8529 | |||||
| QGEN / Qiagen N.V. | 0.02 | 6.39 | 0.85 | 27.46 | 0.8299 | 0.1939 | |||
| ATR / AptarGroup, Inc. | 0.01 | -15.44 | 0.82 | -10.87 | 0.7974 | -0.0755 | |||
| BLD / TopBuild Corp. | 0.00 | 0.67 | 0.6469 | 0.6469 | |||||
| TTC / The Toro Company | 0.01 | 145.97 | 0.64 | 139.41 | 0.6264 | 0.3706 | |||
| REYN / Reynolds Consumer Products Inc. | 0.03 | -65.75 | 0.64 | -69.25 | 0.6180 | -1.3434 | |||
| HOLX / Hologic, Inc. | 0.01 | 0.62 | 0.6000 | 0.6000 | |||||
| ASH / Ashland Inc. | 0.01 | -5.72 | 0.57 | -20.06 | 0.5504 | -0.1215 | |||
| DCI / Donaldson Company, Inc. | 0.01 | -5.53 | 0.43 | -2.48 | 0.4215 | 0.0005 | |||
| AXS / AXIS Capital Holdings Limited | 0.00 | -21.20 | 0.43 | -18.43 | 0.4135 | -0.0809 | |||
| Amrize Ltd / EC (CH1430134226) | 0.01 | 0.40 | 0.3909 | 0.3909 | |||||
| NUE / Nucor Corporation | 0.00 | 0.36 | 0.3469 | 0.3469 | |||||
| PRMB / Primo Brands Corporation | 0.01 | 0.33 | 0.3233 | 0.3233 | |||||
| RH / RH | 0.00 | -7.02 | 0.32 | -25.18 | 0.3066 | -0.0925 | |||
| US715ESC0267 / ESC WTS PERSHING SQUA | 0.01 | 0.00 | 0.00 | 0.0000 | 0.0000 | ||||
| US715ESC0184 / ESC PERSHING SQUARE | 0.13 | 0.00 | 0.00 | 0.0000 | 0.0000 | ||||
| IMB / Imperial Brands PLC | 0.04 | 0.00 | 0.00 | 0.0000 | 0.0000 |