Basic Stats
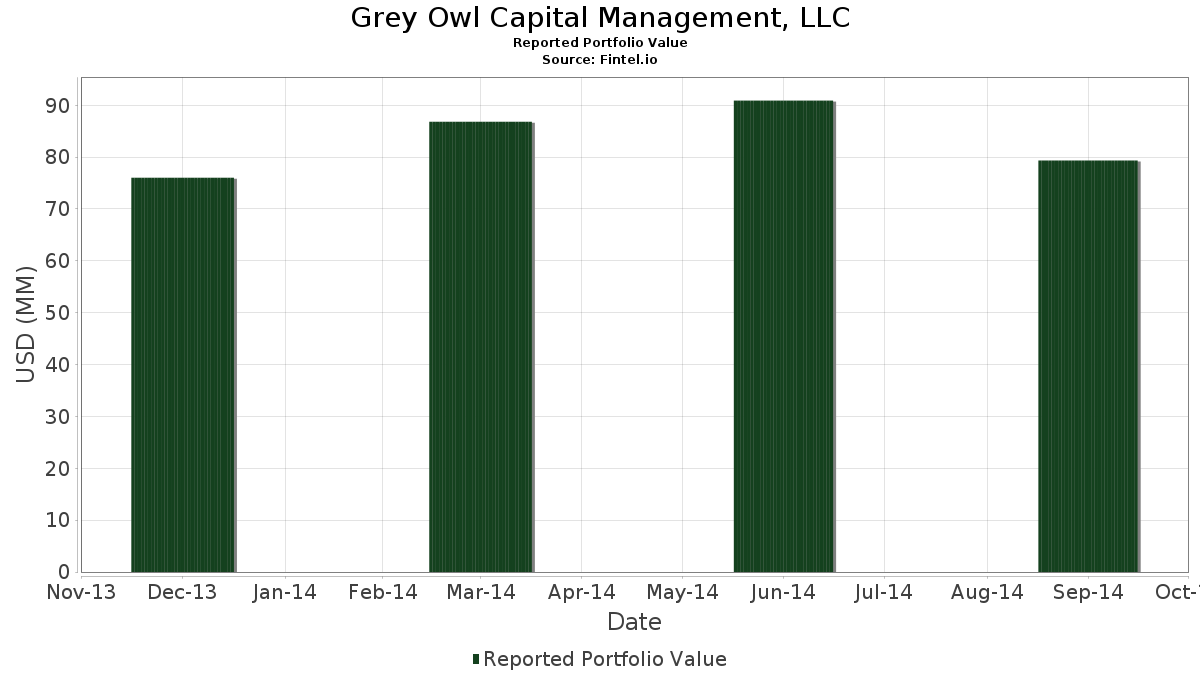
| Portfolio Value | $ 79,348,000 |
| Current Positions | 48 |
Latest Holdings, Performance, AUM (from 13F, 13D)
Grey Owl Capital Management, LLC has disclosed 48 total holdings in their latest SEC filings. Most recent portfolio value is calculated to be $ 79,348,000 USD. Actual Assets Under Management (AUM) is this value plus cash (which is not disclosed). Grey Owl Capital Management, LLC’s top holdings are Berkshire Hathaway Inc. (US:BRK.B) , iShares Gold Trust (US:IAU) , Markel Group Inc. (US:MKL) , Express Scripts Holding Co. (US:ESRX) , and NOV Inc. (US:NOV) . Grey Owl Capital Management, LLC’s new positions include Cabot Oil & Gas Corp. (US:COG) , Lockheed Martin Corporation (US:LMT) , Limbach Holdings, Inc. (US:LMB) , Zions Bancorporation, National Association (US:ZION) , and Winthrop Realty Trust, Inc. (US:FUR) .
Top Increases This Quarter
We use the change in the portfolio allocation because this is the most meaningful metric. Changes can be due to trades or changes in share prices.
| Security | Shares (MM) |
Value (MM$) |
Portfolio % | ΔPortfolio % |
|---|---|---|---|---|
| 0.08 | 1.93 | 2.4273 | 2.4273 | |
| 0.05 | 1.77 | 2.2256 | 2.2256 | |
| 0.06 | 1.44 | 1.8085 | 1.8085 | |
| 0.02 | 1.42 | 1.7908 | 1.7908 | |
| 0.16 | 3.70 | 4.6680 | 1.7154 | |
| 0.05 | 7.04 | 8.8774 | 1.5287 | |
| 0.06 | 3.66 | 4.6076 | 0.8188 | |
| 0.02 | 0.57 | 0.7171 | 0.7171 | |
| 0.00 | 0.55 | 0.6906 | 0.6906 | |
| 0.08 | 5.73 | 7.2239 | 0.5969 |
Top Decreases This Quarter
We use the change in the portfolio allocation because this is the most meaningful metric. Changes can be due to trades or changes in share prices.
| Security | Shares (MM) |
Value (MM$) |
Portfolio % | ΔPortfolio % |
|---|---|---|---|---|
| 0.10 | 3.05 | 3.8388 | -3.6331 | |
| 0.00 | 0.00 | -2.1144 | ||
| 0.00 | 0.00 | -1.7580 | ||
| 0.01 | 1.27 | 1.6056 | -0.7475 | |
| 0.03 | 1.24 | 1.5640 | -0.3051 | |
| 0.09 | 2.89 | 3.6434 | -0.2025 | |
| 0.01 | 0.74 | 0.9351 | -0.0902 | |
| 0.06 | 4.40 | 5.5439 | -0.0886 | |
| 0.01 | 0.97 | 1.2174 | -0.0191 | |
| 0.09 | 0.43 | 0.5432 | -0.0135 |
13F and Fund Filings
This form was filed on 2014-11-14 for the reporting period 2014-09-30. Click the link icon to see the full transaction history.
Upgrade to unlock premium data and export to Excel ![]() .
.
| Security | Type | Avg Share Price | Shares (MM) |
ΔShares (%) |
ΔShares (%) |
Value ($MM) |
Portfolio (%) |
ΔPortfolio (%) |
|
|---|---|---|---|---|---|---|---|---|---|
| BRK.B / Berkshire Hathaway Inc. | 0.05 | -3.39 | 7.04 | 5.45 | 8.8774 | 1.5287 | |||
| IAU / iShares Gold Trust | 0.58 | -2.43 | 6.84 | -11.37 | 8.6165 | 0.1303 | |||
| MKL / Markel Group Inc. | 0.01 | -7.04 | 6.30 | -9.81 | 7.9372 | 0.2552 | |||
| ESRX / Express Scripts Holding Co. | 0.08 | -6.61 | 5.73 | -4.85 | 7.2239 | 0.5969 | |||
| NOV / NOV Inc. | 0.06 | -7.04 | 4.40 | -14.08 | 5.5439 | -0.0886 | |||
| TLT / iShares Trust - iShares 20+ Year Treasury Bond ETF | 0.03 | -7.38 | 3.97 | -5.14 | 5.0033 | 0.3994 | |||
| JEF / Jefferies Financial Group Inc. | 0.16 | 51.77 | 3.70 | 38.00 | 4.6680 | 1.7154 | |||
| EBAY / eBay Inc. | 0.06 | -6.17 | 3.66 | 6.16 | 4.6076 | 0.8188 | |||
| CG / The Carlyle Group Inc. | 0.10 | -50.00 | 3.05 | -55.15 | 3.8388 | -3.6331 | |||
| CPRT / Copart, Inc. | 0.09 | -5.04 | 2.89 | -17.31 | 3.6434 | -0.2025 | |||
| EXC / Exelon Corporation | 0.08 | -3.62 | 2.82 | -9.93 | 3.5540 | 0.1096 | |||
| 91911K102 / Bausch Health Companies | 0.02 | -6.92 | 2.48 | -3.16 | 3.1267 | 0.3083 | |||
| NLY / Annaly Capital Management, Inc. | 0.21 | -5.72 | 2.24 | -11.90 | 2.8280 | 0.0261 | |||
| BKNG / Booking Holdings Inc. | 0.00 | -7.55 | 1.96 | -10.96 | 2.4664 | 0.0483 | |||
| TFI / SPDR Series Trust - SPDR Nuveen ICE Municipal Bond ETF | 0.08 | 15.99 | 1.93 | 17.58 | 2.4273 | 2.4273 | |||
| COG / Cabot Oil & Gas Corp. | 0.05 | 1.77 | 2.2256 | 2.2256 | |||||
| LH / Labcorp Holdings Inc. | 0.02 | -9.99 | 1.58 | -10.60 | 1.9975 | 0.0471 | |||
| BKLN / Invesco Exchange-Traded Fund Trust II - Invesco Senior Loan ETF | 0.06 | -5.50 | 1.44 | -7.72 | 1.8085 | 1.8085 | |||
| IYR / iShares Trust - iShares U.S. Real Estate ETF | 0.02 | -6.02 | 1.42 | -9.38 | 1.7908 | 1.7908 | |||
| CONVERSANT INC / (21249J105) | 0.04 | -9.54 | 1.36 | 21.97 | 0.0000 | ||||
| CMCSA / Comcast Corporation | 0.03 | 0.00 | 1.35 | 0.15 | 1.7064 | 0.2191 | |||
| AAPL / Apple Inc. | 0.01 | -45.08 | 1.27 | -40.44 | 1.6056 | -0.7475 | |||
| INT / World Fuel Services Corp. | 0.03 | -9.90 | 1.24 | -26.96 | 1.5640 | -0.3051 | |||
| MARKET VECTORS ETF TR / MKT VECTR WIDE (57060U134) | 0.04 | 48.33 | 1.20 | 51.51 | 0.0000 | ||||
| HHC / Howard Hughes Corporation | 0.01 | -9.56 | 0.97 | -14.06 | 1.2174 | -0.0191 | |||
| META / Meta Platforms, Inc. | 0.01 | 0.00 | 0.82 | 17.60 | 1.0359 | 0.2670 | |||
| GLD / SPDR Gold Trust | 0.01 | -12.30 | 0.74 | -20.39 | 0.9351 | -0.0902 | |||
| WHLRP / Wheeler Real Estate Investment Trust, Inc. - Preferred Stock | 0.02 | 60.00 | 0.57 | 51.73 | 0.7171 | 0.7171 | |||
| LMT / Lockheed Martin Corporation | 0.00 | 0.55 | 0.6906 | 0.6906 | |||||
| WHLR / Wheeler Real Estate Investment Trust, Inc. | 0.09 | -11.17 | 0.43 | -14.82 | 0.5432 | -0.0135 | |||
| EFC / Ellington Financial Inc. | 0.02 | 54.26 | 0.38 | 42.86 | 0.4789 | 0.1863 | |||
| XOM / Exxon Mobil Corporation | 0.00 | 0.00 | 0.36 | -6.56 | 0.4487 | 0.0295 | |||
| GM / General Motors Company | 0.01 | 0.00 | 0.34 | -12.07 | 0.4222 | 0.0031 | |||
| LMB / Limbach Holdings, Inc. | 0.03 | 0.29 | 0.3617 | 0.3617 | |||||
| CSCO / Cisco Systems, Inc. | 0.01 | 0.00 | 0.26 | 1.15 | 0.3327 | 0.0456 | |||
| T / AT&T Inc. | 0.01 | 0.00 | 0.26 | -0.39 | 0.3226 | 0.0399 | |||
| ZION / Zions Bancorporation, National Association | 0.01 | 0.23 | 0.2924 | 0.2924 | |||||
| FUR / Winthrop Realty Trust, Inc. | 0.01 | 0.23 | 0.2848 | 0.2848 | |||||
| D / Dominion Energy, Inc. | 0.00 | 0.00 | 0.22 | -3.56 | 0.2735 | 0.2735 | |||
| STGG / STG Group, Inc. | 0.02 | 0.00 | 0.21 | 0.00 | 0.2697 | 0.0343 | |||
| US68244P1075 / 1347 Property Insurance Holdings, Inc. | 0.03 | 0.00 | 0.20 | -12.56 | 0.2458 | 0.2458 | |||
| AEC / Associated Estates Realty Corp | 0.01 | 0.00 | 0.18 | -2.65 | 0.2319 | 0.2319 | |||
| NRZ / New Residential Investment Corp | 0.03 | 0.00 | 0.17 | -7.41 | 0.2205 | 0.0126 | |||
| CAMBW / CAMBRIDGE CAPITAL ACQUISITION CORPORATION | 0.01 | 0.00 | 0.14 | 2,800.00 | 0.1827 | 0.1827 | |||
| QUARTET MERGER CORP / (747717106) | 0.01 | 0.00 | 0.14 | -4.86 | 0.0000 | ||||
| WHLRW / Wheeler Real Estate Investment Trust, Inc., Warrants | 0.03 | 60.00 | 0.01 | 0.00 | 0.0151 | 0.0151 | |||
| CAMBW / CAMBRIDGE CAPITAL ACQUISITION CORPORATION | 0.01 | 0.00 | 0.01 | -95.86 | 0.0076 | 0.0076 | |||
| LMB / Limbach Holdings, Inc. | 0.03 | 0.01 | 0.0063 | 0.0063 | |||||
| ENB / Enbridge Inc. | 0.00 | -100.00 | 0.00 | -100.00 | -2.1144 | ||||
| US35904G1076 / Altisource Residential Corp | 0.00 | -100.00 | 0.00 | -100.00 | 0.0000 | ||||
| POST / Post Holdings, Inc. | 0.00 | -100.00 | 0.00 | -100.00 | 0.0000 | ||||
| MTG / MGIC Investment Corporation | 0.00 | -100.00 | 0.00 | -100.00 | 0.0000 | ||||
| CACQ / Caesars Acquisition Co. | 0.00 | -100.00 | 0.00 | -100.00 | 0.0000 | ||||
| VWO / Vanguard International Equity Index Funds - Vanguard FTSE Emerging Markets ETF | 0.00 | -100.00 | 0.00 | -100.00 | 0.0000 | ||||
| UPLMQ / Ultra Petroleum Corp. | 0.00 | -100.00 | 0.00 | -100.00 | -1.7580 |