Basic Stats
| Portfolio Value | $ 43,922,107 |
| Current Positions | 120 |
Latest Holdings, Performance, AUM (from 13F, 13D)
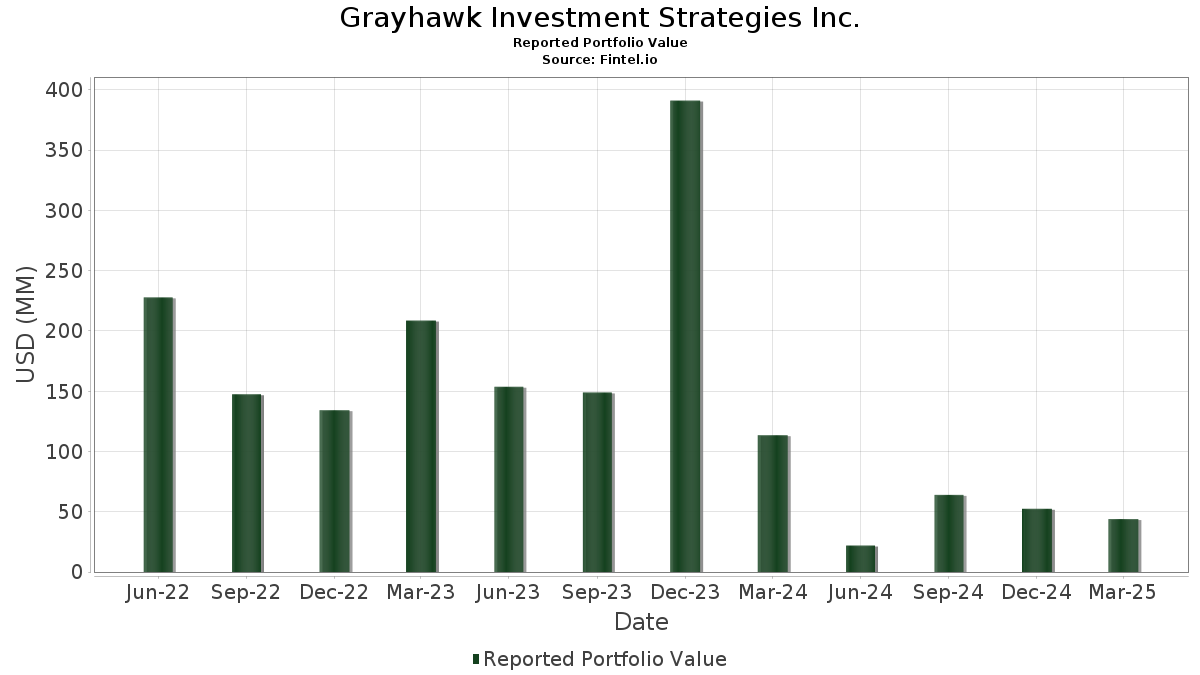
Grayhawk Investment Strategies Inc. has disclosed 120 total holdings in their latest SEC filings. Most recent portfolio value is calculated to be $ 43,922,107 USD. Actual Assets Under Management (AUM) is this value plus cash (which is not disclosed). Grayhawk Investment Strategies Inc.’s top holdings are iShares Trust - iShares MSCI EAFE Value ETF (US:EFV) , iShares Trust - iShares Core S&P 500 ETF (US:IVV) , Vanguard Admiral Funds - Vanguard S&P 500 Value ETF (US:VOOV) , iShares Trust - iShares MSCI EAFE Growth ETF (US:EFG) , and Harbor ETF Trust - Harbor Commodity All-Weather Strategy ETF (US:HGER) . Grayhawk Investment Strategies Inc.’s new positions include Brookfield Property Preferred L.P. - Preferred Security (US:BPYP.M) , .
Top Increases This Quarter
We use the change in the portfolio allocation because this is the most meaningful metric. Changes can be due to trades or changes in share prices.
| Security | Shares (MM) |
Value (MM$) |
Portfolio % | ΔPortfolio % |
|---|---|---|---|---|
| 0.04 | 3.64 | 8.2981 | 1.6714 | |
| 0.01 | 5.45 | 12.4170 | 1.5259 | |
| 0.11 | 6.37 | 14.4995 | 0.8525 | |
| 0.16 | 3.91 | 8.9133 | 0.8447 | |
| 0.03 | 1.29 | 2.9297 | 0.7194 | |
| 0.02 | 1.21 | 2.7465 | 0.6284 | |
| 0.02 | 0.58 | 1.3285 | 0.3468 | |
| 0.01 | 0.42 | 0.9484 | 0.2139 | |
| 0.00 | 0.07 | 0.1570 | 0.1570 | |
| 0.00 | 0.26 | 0.6014 | 0.1543 |
Top Decreases This Quarter
We use the change in the portfolio allocation because this is the most meaningful metric. Changes can be due to trades or changes in share prices.
| Security | Shares (MM) |
Value (MM$) |
Portfolio % | ΔPortfolio % |
|---|---|---|---|---|
| 0.01 | 2.54 | 5.7876 | -4.4694 | |
| 0.01 | 3.64 | 8.2810 | -1.6820 | |
| 0.03 | 5.11 | 11.6287 | -0.7616 | |
| 0.00 | 0.03 | 0.0662 | -0.4041 | |
| 0.00 | 0.52 | 1.1892 | -0.2614 | |
| 0.04 | 4.20 | 9.5510 | -0.2036 | |
| 0.00 | 0.54 | 1.2327 | -0.2024 | |
| 0.00 | 0.03 | 0.0650 | -0.0170 | |
| 0.00 | 0.05 | 0.1067 | -0.0170 | |
| 0.00 | 0.01 | 0.0230 | -0.0070 |
13F and Fund Filings
This form was filed on 2025-05-15 for the reporting period 2025-03-31. Click the link icon to see the full transaction history.
Upgrade to unlock premium data and export to Excel ![]() .
.
| Security | Type | Avg Share Price | Shares (MM) |
ΔShares (%) |
ΔShares (%) |
Value ($MM) |
Portfolio (%) |
ΔPortfolio (%) |
|
|---|---|---|---|---|---|---|---|---|---|
| EFV / iShares Trust - iShares MSCI EAFE Value ETF | 0.11 | -20.81 | 6.37 | -11.05 | 14.4995 | 0.8525 | |||
| IVV / iShares Trust - iShares Core S&P 500 ETF | 0.01 | 0.00 | 5.45 | -4.55 | 12.4170 | 1.5259 | |||
| VOOV / Vanguard Admiral Funds - Vanguard S&P 500 Value ETF | 0.03 | -21.29 | 5.11 | -21.43 | 11.6287 | -0.7616 | |||
| EFG / iShares Trust - iShares MSCI EAFE Growth ETF | 0.04 | -20.62 | 4.20 | -18.02 | 9.5510 | -0.2036 | |||
| HGER / Harbor ETF Trust - Harbor Commodity All-Weather Strategy ETF | 0.16 | -14.88 | 3.91 | -7.51 | 8.9133 | 0.8447 | |||
| USMV / iShares Trust - iShares MSCI USA Min Vol Factor ETF | 0.04 | -0.61 | 3.64 | 4.83 | 8.2981 | 1.6714 | |||
| VGT / Vanguard World Fund - Vanguard Information Technology ETF | 0.01 | -20.22 | 3.64 | -30.41 | 8.2810 | -1.6820 | |||
| VOOG / Vanguard Admiral Funds - Vanguard S&P 500 Growth ETF | 0.01 | -48.30 | 2.54 | -52.76 | 5.7876 | -4.4694 | |||
| NTR / Nutrien Ltd. | 0.03 | 0.00 | 1.29 | 10.96 | 2.9297 | 0.7194 | |||
| VYMI / Vanguard Whitehall Funds - Vanguard International High Dividend Yield ETF | 0.02 | 0.00 | 1.21 | 8.55 | 2.7465 | 0.6284 | |||
| IDV / iShares Trust - iShares International Select Dividend ETF | 0.02 | 0.00 | 0.58 | 13.20 | 1.3285 | 0.3468 | |||
| IWN / iShares Trust - iShares Russell 2000 Value ETF | 0.00 | -21.81 | 0.54 | -28.06 | 1.2327 | -0.2024 | |||
| IWO / iShares Trust - iShares Russell 2000 Growth ETF | 0.00 | -22.69 | 0.52 | -31.32 | 1.1892 | -0.2614 | |||
| EFA / iShares Trust - iShares MSCI EAFE ETF | 0.01 | 0.00 | 0.42 | 8.05 | 0.9484 | 0.2139 | |||
| RY / Royal Bank of Canada | 0.00 | 0.00 | 0.31 | -6.65 | 0.7057 | 0.0736 | |||
| EFAV / iShares Trust - iShares MSCI EAFE Min Vol Factor ETF | 0.00 | -8.28 | 0.29 | 1.05 | 0.6585 | 0.1131 | |||
| TD / The Toronto-Dominion Bank | 0.00 | 0.00 | 0.26 | 12.82 | 0.6014 | 0.1543 | |||
| SLF / Sun Life Financial Inc. | 0.00 | 0.00 | 0.18 | -3.66 | 0.4197 | 0.0553 | |||
| BN / Brookfield Corporation | 0.00 | 0.00 | 0.15 | -8.75 | 0.3332 | 0.0270 | |||
| EBGEF / Enbridge Inc. - Preferred Stock | 0.00 | 0.00 | 0.14 | 4.58 | 0.3124 | 0.0617 | |||
| AAPL / Apple Inc. | 0.00 | 0.00 | 0.13 | -11.56 | 0.2974 | 0.0167 | |||
| MSFT / Microsoft Corporation | 0.00 | 0.00 | 0.12 | -10.61 | 0.2692 | 0.0161 | |||
| WCN / Waste Connections, Inc. | 0.00 | 0.00 | 0.12 | 13.73 | 0.2658 | 0.0700 | |||
| SU / Suncor Energy Inc. | 0.00 | 0.00 | 0.12 | 8.41 | 0.2648 | 0.0605 | |||
| BCE / BCE Inc. | 0.00 | 0.00 | 0.11 | -0.89 | 0.2543 | 0.0394 | |||
| MFC / Manulife Financial Corporation | 0.00 | 0.00 | 0.10 | 1.06 | 0.2186 | 0.0382 | |||
| CP / Canadian Pacific Kansas City Limited | 0.00 | 0.00 | 0.10 | -3.06 | 0.2165 | 0.0296 | |||
| BRK.B / Berkshire Hathaway Inc. | 0.00 | 0.00 | 0.09 | 16.88 | 0.2061 | 0.0593 | |||
| TU / TELUS Corporation | 0.01 | 0.00 | 0.09 | 6.17 | 0.1973 | 0.0412 | |||
| GOOGL / Alphabet Inc. | 0.00 | 0.00 | 0.09 | -18.87 | 0.1972 | -0.0049 | |||
| META / Meta Platforms, Inc. | 0.00 | 0.00 | 0.08 | -2.38 | 0.1890 | 0.0283 | |||
| C / Citigroup Inc. | 0.00 | 0.00 | 0.08 | 1.30 | 0.1778 | 0.0302 | |||
| XOM / Exxon Mobil Corporation | 0.00 | 0.00 | 0.08 | 11.94 | 0.1709 | 0.0415 | |||
| NVDD / Direxion Shares ETF Trust - Direxion Daily NVDA Bear 1X Shares | 0.00 | 0.00 | 0.07 | -18.82 | 0.1579 | -0.0059 | |||
| AEM / Agnico Eagle Mines Limited | 0.00 | 0.07 | 0.1570 | 0.1570 | |||||
| AMZN / Amazon.com, Inc. | 0.00 | 0.00 | 0.07 | -12.82 | 0.1559 | 0.0054 | |||
| CIGI / Colliers International Group Inc. | 0.00 | 0.00 | 0.07 | -11.84 | 0.1543 | 0.0092 | |||
| CNQ / Canadian Natural Resources Limited | 0.00 | 0.00 | 0.06 | 0.00 | 0.1370 | 0.0220 | |||
| SPGI / S&P Global Inc. | 0.00 | 0.00 | 0.06 | 1.79 | 0.1319 | 0.0237 | |||
| AON / Aon plc | 0.00 | 0.00 | 0.06 | 9.80 | 0.1290 | 0.0318 | |||
| JPM / JPMorgan Chase & Co. | 0.00 | 0.00 | 0.05 | 1.89 | 0.1240 | 0.0225 | |||
| ORLY / O'Reilly Automotive, Inc. | 0.00 | 0.00 | 0.05 | 21.95 | 0.1142 | 0.0350 | |||
| BIP / Brookfield Infrastructure Partners L.P. - Limited Partnership | 0.00 | 0.00 | 0.05 | -5.77 | 0.1122 | 0.0119 | |||
| UNH / UnitedHealth Group Incorporated | 0.00 | 0.00 | 0.05 | 4.26 | 0.1121 | 0.0215 | |||
| AVGO / Broadcom Inc. | 0.00 | 0.00 | 0.05 | -28.12 | 0.1067 | -0.0170 | |||
| TRP / TC Energy Corporation | 0.00 | 0.00 | 0.04 | 2.33 | 0.1013 | 0.0176 | |||
| TJX / The TJX Companies, Inc. | 0.00 | 0.00 | 0.04 | 2.33 | 0.1004 | 0.0170 | |||
| PH / Parker-Hannifin Corporation | 0.00 | 0.00 | 0.04 | -2.44 | 0.0913 | 0.0113 | |||
| BAC / Bank of America Corporation | 0.00 | 0.00 | 0.04 | -5.13 | 0.0852 | 0.0101 | |||
| PFE / Pfizer Inc. | 0.00 | 0.00 | 0.04 | -5.13 | 0.0849 | 0.0105 | |||
| MA / Mastercard Incorporated | 0.00 | 0.00 | 0.04 | 2.94 | 0.0811 | 0.0159 | |||
| BAM / Brookfield Asset Management Ltd. | 0.00 | 0.00 | 0.03 | -10.53 | 0.0782 | 0.0049 | |||
| UNP / Union Pacific Corporation | 0.00 | 0.00 | 0.03 | 3.03 | 0.0780 | 0.0150 | |||
| GOLD / Barrick Mining Corporation | 0.00 | 0.00 | 0.03 | 26.92 | 0.0760 | 0.0252 | |||
| V / Visa Inc. | 0.00 | 0.00 | 0.03 | 11.11 | 0.0694 | 0.0170 | |||
| BTG / B2Gold Corp. | 0.01 | 0.00 | 0.03 | 15.38 | 0.0691 | 0.0193 | |||
| IGIFF / IGM Financial Inc. | 0.00 | 0.00 | 0.03 | -3.23 | 0.0684 | 0.0090 | |||
| HD / The Home Depot, Inc. | 0.00 | 0.00 | 0.03 | -6.45 | 0.0668 | 0.0074 | |||
| ACWI / iShares Trust - iShares MSCI ACWI ETF | 0.00 | -88.10 | 0.03 | -88.21 | 0.0662 | -0.4041 | |||
| CME / CME Group Inc. | 0.00 | 0.00 | 0.03 | 12.00 | 0.0658 | 0.0176 | |||
| DOOO / BRP Inc. | 0.00 | 0.00 | 0.03 | -34.88 | 0.0650 | -0.0170 | |||
| HLT / Hilton Worldwide Holdings Inc. | 0.00 | 0.00 | 0.03 | -10.71 | 0.0591 | 0.0054 | |||
| OTEX / Open Text Corporation | 0.00 | 0.00 | 0.03 | -10.71 | 0.0583 | 0.0036 | |||
| SHW / The Sherwin-Williams Company | 0.00 | 0.00 | 0.02 | 4.35 | 0.0549 | 0.0101 | |||
| COST / Costco Wholesale Corporation | 0.00 | 0.00 | 0.02 | 4.76 | 0.0517 | 0.0098 | |||
| INTU / Intuit Inc. | 0.00 | 0.00 | 0.02 | 0.00 | 0.0503 | 0.0072 | |||
| NOC / Northrop Grumman Corporation | 0.00 | 0.00 | 0.02 | 5.26 | 0.0478 | 0.0111 | |||
| PG / The Procter & Gamble Company | 0.00 | 0.00 | 0.02 | 0.00 | 0.0473 | 0.0083 | |||
| ADBE / Adobe Inc. | 0.00 | 0.00 | 0.02 | -16.67 | 0.0472 | 0.0014 | |||
| CAT / Caterpillar Inc. | 0.00 | 0.00 | 0.02 | -9.09 | 0.0458 | 0.0036 | |||
| FANG / Diamondback Energy, Inc. | 0.00 | 0.00 | 0.02 | 0.00 | 0.0444 | 0.0063 | |||
| TXN / Texas Instruments Incorporated | 0.00 | 0.00 | 0.02 | -5.26 | 0.0421 | 0.0053 | |||
| TMO / Thermo Fisher Scientific Inc. | 0.00 | 0.00 | 0.02 | -5.26 | 0.0419 | 0.0052 | |||
| SPG / Simon Property Group, Inc. | 0.00 | 0.00 | 0.02 | -5.56 | 0.0397 | 0.0052 | |||
| ULTA / Ulta Beauty, Inc. | 0.00 | 0.00 | 0.02 | -20.00 | 0.0384 | 0.0003 | |||
| COF / Capital One Financial Corporation | 0.00 | 0.00 | 0.02 | 0.00 | 0.0380 | 0.0064 | |||
| MCD / McDonald's Corporation | 0.00 | 0.00 | 0.02 | 6.67 | 0.0377 | 0.0084 | |||
| GE / General Electric Company | 0.00 | 0.00 | 0.02 | 23.08 | 0.0369 | 0.0112 | |||
| QCOM / QUALCOMM Incorporated | 0.00 | 0.00 | 0.02 | 0.00 | 0.0343 | 0.0056 | |||
| MU / Micron Technology, Inc. | 0.00 | 0.00 | 0.01 | 0.00 | 0.0338 | 0.0064 | |||
| MGA / Magna International Inc. | 0.00 | 0.00 | 0.01 | -17.65 | 0.0327 | -0.0010 | |||
| FIS / Fidelity National Information Services, Inc. | 0.00 | 0.00 | 0.01 | -7.14 | 0.0308 | 0.0029 | |||
| YUM / Yum! Brands, Inc. | 0.00 | 0.00 | 0.01 | 9.09 | 0.0294 | 0.0084 | |||
| GILD / Gilead Sciences, Inc. | 0.00 | 0.00 | 0.01 | 20.00 | 0.0283 | 0.0088 | |||
| ETR / Entergy Corporation | 0.00 | 0.00 | 0.01 | 20.00 | 0.0280 | 0.0072 | |||
| ABT / Abbott Laboratories | 0.00 | 0.00 | 0.01 | 20.00 | 0.0275 | 0.0079 | |||
| MRK / Merck & Co., Inc. | 0.00 | 0.00 | 0.01 | -7.69 | 0.0274 | 0.0020 | |||
| MDT / Medtronic plc | 0.00 | 0.00 | 0.01 | 10.00 | 0.0260 | 0.0066 | |||
| KO / The Coca-Cola Company | 0.00 | 0.00 | 0.01 | 22.22 | 0.0251 | 0.0068 | |||
| PPG / PPG Industries, Inc. | 0.00 | 0.00 | 0.01 | -9.09 | 0.0237 | 0.0020 | |||
| TSLA / Tesla, Inc. | 0.00 | 0.00 | 0.01 | -33.33 | 0.0230 | -0.0070 | |||
| BDX / Becton, Dickinson and Company | 0.00 | 0.00 | 0.01 | 0.00 | 0.0219 | 0.0037 | |||
| ESS / Essex Property Trust, Inc. | 0.00 | 0.00 | 0.01 | 12.50 | 0.0209 | 0.0046 | |||
| DHR / Danaher Corporation | 0.00 | 0.00 | 0.01 | -11.11 | 0.0201 | 0.0013 | |||
| DIS / The Walt Disney Company | 0.00 | 0.00 | 0.01 | -11.11 | 0.0196 | 0.0011 | |||
| JNJ / Johnson & Johnson | 0.00 | 0.00 | 0.01 | 14.29 | 0.0185 | 0.0050 | |||
| ZTS / Zoetis Inc. | 0.00 | 0.00 | 0.01 | 0.00 | 0.0172 | 0.0030 | |||
| CMCSA / Comcast Corporation | 0.00 | 0.00 | 0.01 | 0.00 | 0.0167 | 0.0025 | |||
| NEE / NextEra Energy, Inc. | 0.00 | 0.00 | 0.01 | 0.00 | 0.0165 | 0.0025 | |||
| PYPL / PayPal Holdings, Inc. | 0.00 | 0.00 | 0.01 | -25.00 | 0.0150 | -0.0014 | |||
| GM / General Motors Company | 0.00 | 0.00 | 0.01 | -14.29 | 0.0143 | 0.0007 | |||
| GEV / GE Vernova Inc. | 0.00 | 0.00 | 0.01 | 0.00 | 0.0139 | 0.0014 | |||
| CHTR / Charter Communications, Inc. | 0.00 | 0.00 | 0.01 | 0.00 | 0.0126 | 0.0028 | |||
| SWK / Stanley Black & Decker, Inc. | 0.00 | 0.00 | 0.01 | 0.00 | 0.0119 | 0.0015 | |||
| DOW / Dow Inc. | 0.00 | 0.00 | 0.01 | 0.00 | 0.0114 | 0.0004 | |||
| F / Ford Motor Company | 0.00 | 0.00 | 0.00 | 0.00 | 0.0107 | 0.0019 | |||
| AFK / VanEck ETF Trust - VanEck Africa Index ETF | 0.00 | 0.00 | 0.00 | 50.00 | 0.0089 | 0.0034 | |||
| SIL / Global X Funds - Global X Silver Miners ETF | 0.00 | 0.00 | 0.00 | 50.00 | 0.0081 | 0.0026 | |||
| INTC / Intel Corporation | 0.00 | 0.00 | 0.00 | 0.00 | 0.0080 | 0.0021 | |||
| SILJ / Amplify ETF Trust - Amplify Junior Silver Miners ETF | 0.00 | 0.00 | 0.00 | 0.00 | 0.0065 | 0.0020 | |||
| GDXJ / VanEck ETF Trust - VanEck Junior Gold Miners ETF | 0.00 | 0.00 | 0.00 | 100.00 | 0.0059 | 0.0022 | |||
| GEHC / GE HealthCare Technologies Inc. | 0.00 | 0.00 | 0.00 | 0.00 | 0.0050 | 0.0009 | |||
| SFBS / ServisFirst Bancshares, Inc. | 0.00 | 0.00 | 0.00 | -50.00 | 0.0045 | 0.0006 | |||
| WAB / Westinghouse Air Brake Technologies Corporation | 0.00 | 0.00 | 0.00 | 0.00 | 0.0033 | 0.0004 | |||
| VLTO / Veralto Corporation | 0.00 | 0.00 | 0.00 | 0.00 | 0.0031 | 0.0004 | |||
| VTRS / Viatris Inc. | 0.00 | 0.00 | 0.00 | 0.00 | 0.0029 | -0.0006 | |||
| AQN / Algonquin Power & Utilities Corp. | 0.00 | 0.00 | 0.00 | 0.0024 | 0.0007 | ||||
| BNT / Brookfield Wealth Solutions Ltd. | 0.00 | 0.00 | 0.00 | -100.00 | 0.0023 | 0.0002 | |||
| EMBC / Embecta Corp. | 0.00 | 0.00 | 0.00 | 0.0002 | -0.0001 | ||||
| BPYP.M / Brookfield Property Preferred L.P. - Preferred Security | 0.00 | 0.00 | 0.0001 | 0.0001 | |||||
| FSV / FirstService Corporation | 0.00 | -100.00 | 0.00 | 0.0000 | |||||
| SPY / SPDR S&P 500 ETF | 0.00 | -100.00 | 0.00 | 0.0000 |