Basic Stats
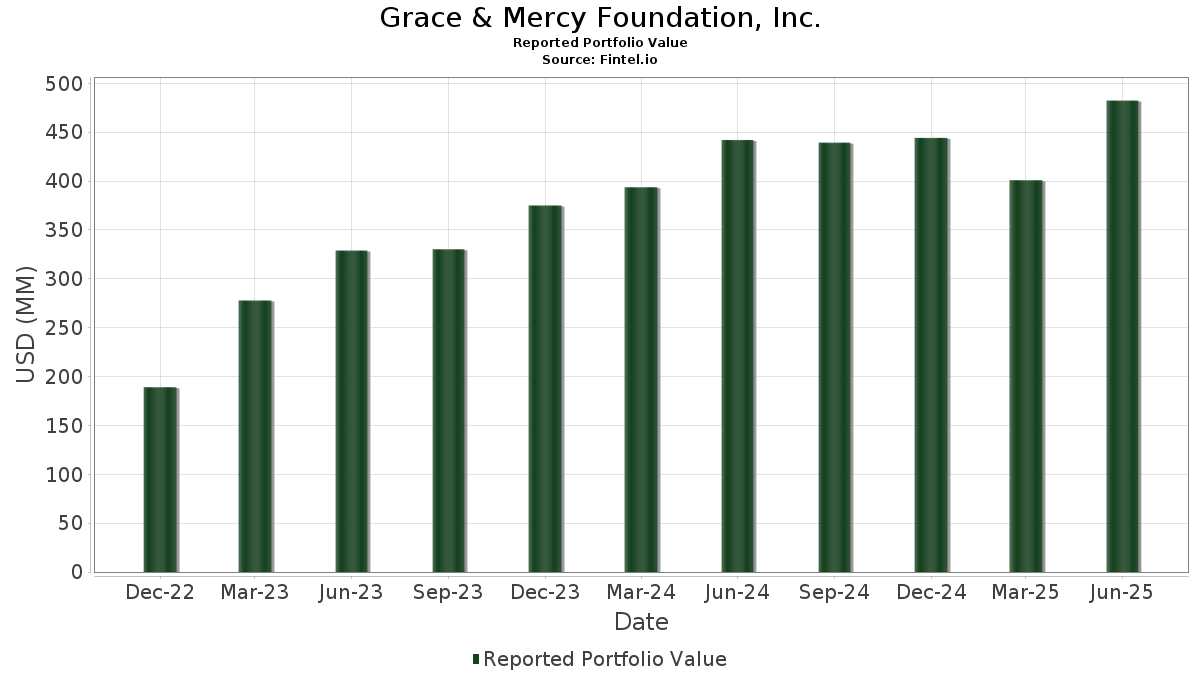
| Portfolio Value | $ 482,347,954 |
| Current Positions | 18 |
Latest Holdings, Performance, AUM (from 13F, 13D)
Grace & Mercy Foundation, Inc. has disclosed 18 total holdings in their latest SEC filings. Most recent portfolio value is calculated to be $ 482,347,954 USD. Actual Assets Under Management (AUM) is this value plus cash (which is not disclosed). Grace & Mercy Foundation, Inc.’s top holdings are Alphabet Inc. (US:GOOGL) , Netflix, Inc. (US:NFLX) , Meta Platforms, Inc. (US:META) , Amazon.com, Inc. (US:AMZN) , and Microsoft Corporation (US:MSFT) .
Top Increases This Quarter
We use the change in the portfolio allocation because this is the most meaningful metric. Changes can be due to trades or changes in share prices.
| Security | Shares (MM) |
Value (MM$) |
Portfolio % | ΔPortfolio % |
|---|---|---|---|---|
| 0.25 | 30.73 | 6.3709 | 3.0271 | |
| 0.13 | 14.11 | 2.9247 | 0.9747 | |
| 0.03 | 31.46 | 6.5221 | 0.4446 | |
| 0.01 | 1.58 | 0.3275 | 0.3275 | |
| 0.01 | 3.76 | 0.7789 | 0.3183 | |
| 0.97 | 15.37 | 3.1857 | 0.2985 | |
| 0.02 | 5.44 | 1.1269 | 0.2159 | |
| 0.05 | 66.65 | 13.8172 | 0.2079 | |
| 0.12 | 58.96 | 12.2231 | 0.1209 |
Top Decreases This Quarter
We use the change in the portfolio allocation because this is the most meaningful metric. Changes can be due to trades or changes in share prices.
| Security | Shares (MM) |
Value (MM$) |
Portfolio % | ΔPortfolio % |
|---|---|---|---|---|
| 0.12 | 45.78 | 9.4902 | -1.6201 | |
| 0.28 | 61.32 | 12.7133 | -1.6127 | |
| 0.38 | 66.69 | 13.8251 | -0.9929 | |
| 0.05 | 10.73 | 2.2246 | -0.6736 | |
| 0.09 | 65.64 | 13.6089 | -0.5528 | |
| 0.00 | 1.20 | 0.2492 | -0.2798 | |
| 0.01 | 0.95 | 0.1975 | -0.0318 | |
| 0.02 | 1.42 | 0.2946 | -0.0222 | |
| 0.01 | 0.58 | 0.1196 | -0.0158 |
13F and Fund Filings
This form was filed on 2025-08-14 for the reporting period 2025-06-30. Click the link icon to see the full transaction history.
Upgrade to unlock premium data and export to Excel ![]() .
.
| Security | Type | Avg Share Price | Shares (MM) |
ΔShares (%) |
ΔShares (%) |
Value ($MM) |
Portfolio (%) |
ΔPortfolio (%) |
|
|---|---|---|---|---|---|---|---|---|---|
| GOOGL / Alphabet Inc. | 0.38 | -1.49 | 66.69 | 12.27 | 13.8251 | -0.9929 | |||
| NFLX / Netflix, Inc. | 0.05 | -14.92 | 66.65 | 22.17 | 13.8172 | 0.2079 | |||
| META / Meta Platforms, Inc. | 0.09 | -9.70 | 65.64 | 15.64 | 13.6089 | -0.5528 | |||
| AMZN / Amazon.com, Inc. | 0.28 | -7.39 | 61.32 | 6.79 | 12.7133 | -1.6127 | |||
| MSFT / Microsoft Corporation | 0.12 | -8.28 | 58.96 | 21.54 | 12.2231 | 0.1209 | |||
| ADBE / Adobe Inc. | 0.12 | 1.89 | 45.78 | 2.78 | 9.4902 | -1.6201 | |||
| NOW / ServiceNow, Inc. | 0.03 | 0.00 | 31.46 | 29.14 | 6.5221 | 0.4446 | |||
| DIS / The Walt Disney Company | 0.25 | 82.47 | 30.73 | 129.27 | 6.3709 | 3.0271 | |||
| LYFT / Lyft, Inc. | 0.97 | 0.00 | 15.37 | 32.77 | 3.1857 | 0.2985 | |||
| RBLX / Roblox Corporation | 0.13 | 0.00 | 14.11 | 80.49 | 2.9247 | 0.9747 | |||
| AAPL / Apple Inc. | 0.05 | 0.00 | 10.73 | -7.64 | 2.2246 | -0.6736 | |||
| TSM / Taiwan Semiconductor Manufacturing Company Limited - Depositary Receipt (Common Stock) | 0.02 | 9.09 | 5.44 | 48.82 | 1.1269 | 0.2159 | |||
| COIN / Coinbase Global, Inc. | 0.01 | 0.00 | 3.76 | 103.47 | 0.7789 | 0.3183 | |||
| NVDA / NVIDIA Corporation | 0.01 | 1.58 | 0.3275 | 0.3275 | |||||
| NKE / NIKE, Inc. | 0.02 | 0.00 | 1.42 | 11.90 | 0.2946 | -0.0222 | |||
| ASML / ASML Holding N.V. - Depositary Receipt (Common Stock) | 0.00 | -53.12 | 1.20 | -43.30 | 0.2492 | -0.2798 | |||
| PCOR / Procore Technologies, Inc. | 0.01 | 0.00 | 0.95 | 3.59 | 0.1975 | -0.0318 | |||
| ETSY / Etsy, Inc. | 0.01 | 0.00 | 0.58 | 6.27 | 0.1196 | -0.0158 | |||
| CRM / Salesforce, Inc. | 0.00 | -100.00 | 0.00 | 0.0000 |