Basic Stats
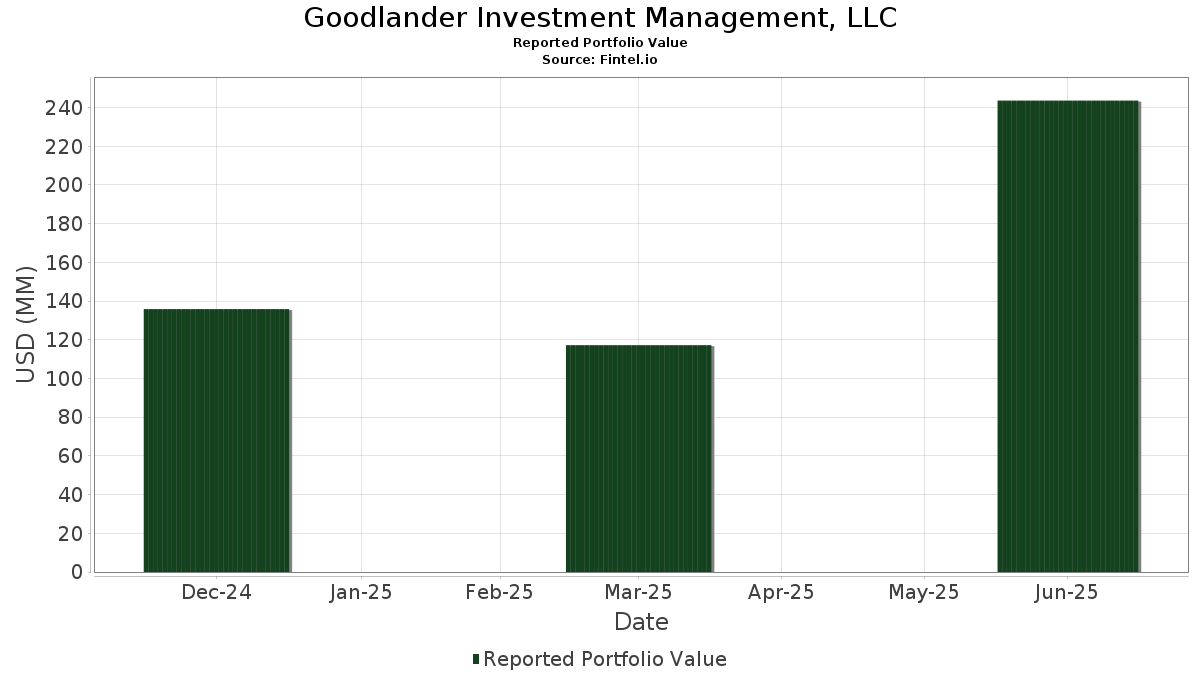
| Portfolio Value | $ 243,617,498 |
| Current Positions | 11 |
Latest Holdings, Performance, AUM (from 13F, 13D)
Goodlander Investment Management, LLC has disclosed 11 total holdings in their latest SEC filings. Most recent portfolio value is calculated to be $ 243,617,498 USD. Actual Assets Under Management (AUM) is this value plus cash (which is not disclosed). Goodlander Investment Management, LLC’s top holdings are Core Scientific, Inc. (US:CORZ) , MasTec, Inc. (US:MTZ) , NRG Energy, Inc. (US:NRG) , Darling Ingredients Inc. (US:DAR) , and Argan, Inc. (US:AGX) . Goodlander Investment Management, LLC’s new positions include Core Scientific, Inc. (US:CORZ) , Solaris Energy Infrastructure, Inc. (US:SEI) , Generac Holdings Inc. (US:GNRC) , Bloom Energy Corporation (US:BE) , and TeraWulf Inc. (US:WULF) .
Top Increases This Quarter
We use the change in the portfolio allocation because this is the most meaningful metric. Changes can be due to trades or changes in share prices.
| Security | Shares (MM) |
Value (MM$) |
Portfolio % | ΔPortfolio % |
|---|---|---|---|---|
| 2.05 | 34.99 | 14.3641 | 14.3641 | |
| 0.13 | 25.60 | 10.5098 | 10.5098 | |
| 0.70 | 19.80 | 8.1287 | 8.1287 | |
| 0.10 | 14.32 | 5.8785 | 5.8785 | |
| 0.75 | 28.45 | 11.6802 | 5.5507 | |
| 0.50 | 11.96 | 4.9093 | 4.9093 | |
| 0.19 | 30.19 | 12.3920 | 4.2486 | |
| 0.07 | 8.99 | 3.6897 | 3.6897 | |
| 2.00 | 8.76 | 3.5958 | 3.5958 |
Top Decreases This Quarter
We use the change in the portfolio allocation because this is the most meaningful metric. Changes can be due to trades or changes in share prices.
| Security | Shares (MM) |
Value (MM$) |
Portfolio % | ΔPortfolio % |
|---|---|---|---|---|
| 0.20 | 34.09 | 13.9916 | -5.4364 | |
| 0.12 | 26.46 | 10.8603 | -4.8053 |
13F and Fund Filings
This form was filed on 2025-08-14 for the reporting period 2025-06-30. Click the link icon to see the full transaction history.
Upgrade to unlock premium data and export to Excel ![]() .
.
| Security | Type | Avg Share Price | Shares (MM) |
ΔShares (%) |
ΔShares (%) |
Value ($MM) |
Portfolio (%) |
ΔPortfolio (%) |
|
|---|---|---|---|---|---|---|---|---|---|
| CORZ / Core Scientific, Inc. | 2.05 | 34.99 | 14.3641 | 14.3641 | |||||
| MTZ / MasTec, Inc. | 0.20 | 2.49 | 34.09 | 49.67 | 13.9916 | -5.4364 | |||
| NRG / NRG Energy, Inc. | 0.19 | 88.00 | 30.19 | 216.25 | 12.3920 | 4.2486 | |||
| DAR / Darling Ingredients Inc. | 0.75 | 226.09 | 28.45 | 296.03 | 11.6802 | 5.5507 | |||
| AGX / Argan, Inc. | 0.12 | -14.29 | 26.46 | 44.08 | 10.8603 | -4.8053 | |||
| VST / Vistra Corp. | 0.13 | 25.60 | 10.5098 | 10.5098 | |||||
| SEI / Solaris Energy Infrastructure, Inc. | 0.70 | 19.80 | 8.1287 | 8.1287 | |||||
| GNRC / Generac Holdings Inc. | 0.10 | 14.32 | 5.8785 | 5.8785 | |||||
| BE / Bloom Energy Corporation | 0.50 | 11.96 | 4.9093 | 4.9093 | |||||
| VRT / Vertiv Holdings Co | 0.07 | 8.99 | 3.6897 | 3.6897 | |||||
| WULF / TeraWulf Inc. | 2.00 | 8.76 | 3.5958 | 3.5958 | |||||
| AR / Antero Resources Corporation | 0.00 | -100.00 | 0.00 | 0.0000 | |||||
| NXT / Nextracker Inc. | 0.00 | -100.00 | 0.00 | 0.0000 | |||||
| ETR / Entergy Corporation | 0.00 | -100.00 | 0.00 | 0.0000 | |||||
| GEV / GE Vernova Inc. | 0.00 | -100.00 | 0.00 | 0.0000 | |||||
| TLNE / Talen Energy Corporation | 0.00 | -100.00 | 0.00 | 0.0000 | |||||
| EXE / Expand Energy Corporation | 0.00 | -100.00 | 0.00 | 0.0000 |