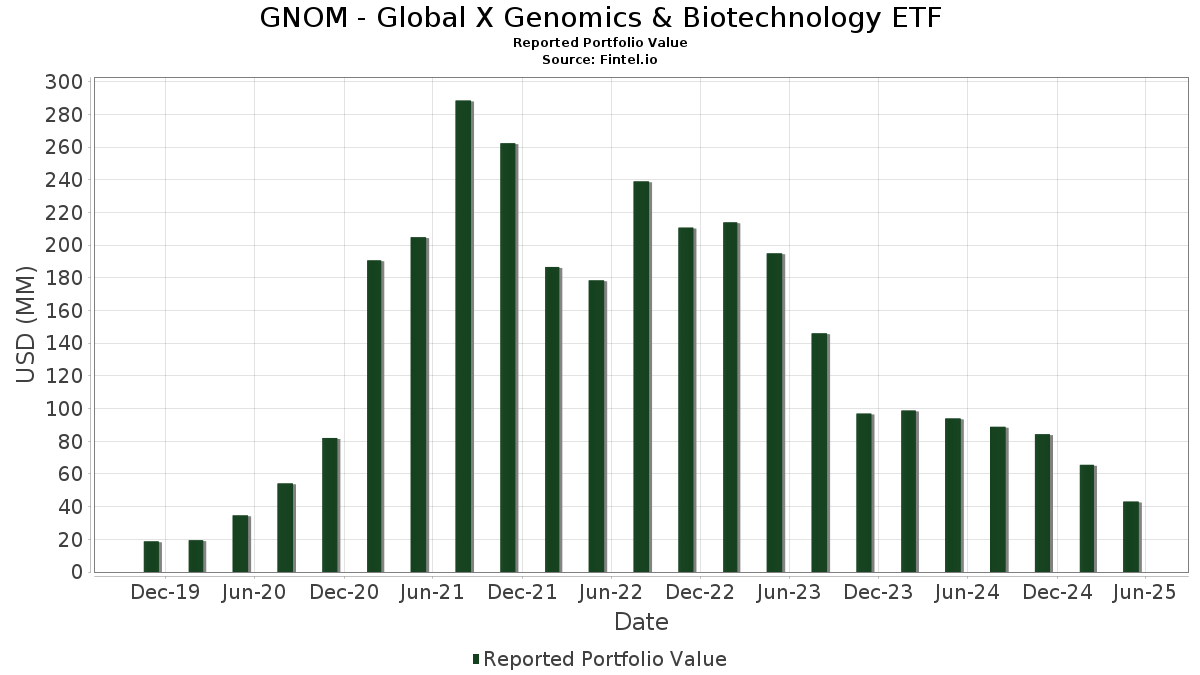
Basic Stats
| Portfolio Value | $ 43,062,297 |
| Current Positions | 50 |
Latest Holdings, Performance, AUM (from 13F, 13D)
GNOM - Global X Genomics & Biotechnology ETF has disclosed 50 total holdings in their latest SEC filings. Most recent portfolio value is calculated to be $ 43,062,297 USD. Actual Assets Under Management (AUM) is this value plus cash (which is not disclosed). GNOM - Global X Genomics & Biotechnology ETF’s top holdings are Alnylam Pharmaceuticals, Inc. (US:ALNY) , Illumina, Inc. (US:ILMN) , Qiagen N.V. (US:QGEN) , Natera, Inc. (US:NTRA) , and Avidity Biosciences, Inc. (US:RNA) . GNOM - Global X Genomics & Biotechnology ETF’s new positions include Guardant Health, Inc. (US:GH) , GeneDx Holdings Corp. (US:WGS) , Twist Bioscience Corporation (US:TWST) , Astrazeneca plc (CH:AZN) , and Bristol-Myers Squibb Company (US:BMY) .
Top Increases This Quarter
We use the change in the portfolio allocation because this is the most meaningful metric. Changes can be due to trades or changes in share prices.
| Security | Shares (MM) |
Value (MM$) |
Portfolio % | ΔPortfolio % |
|---|---|---|---|---|
| 2.09 | 5.0966 | 5.0966 | ||
| 0.04 | 1.56 | 3.7911 | 3.7911 | |
| 0.01 | 1.01 | 2.4672 | 2.4672 | |
| 0.03 | 0.94 | 2.3010 | 2.3010 | |
| 0.01 | 0.92 | 2.2338 | 2.2338 | |
| 0.02 | 0.87 | 2.1145 | 2.1145 | |
| 0.00 | 0.78 | 1.8902 | 1.8902 | |
| 0.02 | 1.88 | 4.5943 | 1.6988 | |
| 0.07 | 1.75 | 4.2628 | 1.5593 | |
| 0.00 | 1.57 | 3.8237 | 1.4676 |
Top Decreases This Quarter
We use the change in the portfolio allocation because this is the most meaningful metric. Changes can be due to trades or changes in share prices.
| Security | Shares (MM) |
Value (MM$) |
Portfolio % | ΔPortfolio % |
|---|---|---|---|---|
| 0.05 | 0.78 | 1.8935 | -2.2739 | |
| 0.01 | 0.93 | 2.2634 | -2.2228 | |
| 0.04 | 1.17 | 2.8541 | -2.1410 | |
| 0.07 | 1.05 | 2.5548 | -1.8721 | |
| 0.01 | 1.86 | 4.5226 | -1.5950 | |
| 0.05 | 0.21 | 0.5126 | -1.5572 | |
| 0.06 | 0.14 | 0.3456 | -1.4028 | |
| 0.06 | 0.38 | 0.9313 | -1.2912 | |
| 0.64 | 1.04 | 2.5355 | -1.2473 | |
| 0.03 | 0.50 | 1.2216 | -1.1910 |
13F and Fund Filings
This form was filed on 2025-07-30 for the reporting period 2025-05-31. Click the link icon to see the full transaction history.
Upgrade to unlock premium data and export to Excel ![]() .
.
| Security | Type | Avg Share Price | Shares (MM) |
ΔShares (%) |
ΔShares (%) |
Value ($MM) |
Portfolio (%) |
ΔPortfolio (%) |
|
|---|---|---|---|---|---|---|---|---|---|
| ALNY / Alnylam Pharmaceuticals, Inc. | 0.01 | -25.98 | 2.20 | -8.64 | 5.3617 | 1.4644 | |||
| BNYREPOS / RA (N/A) | 2.09 | 5.0966 | 5.0966 | ||||||
| ILMN / Illumina, Inc. | 0.02 | 13.71 | 1.88 | 5.37 | 4.5943 | 1.6988 | |||
| QGEN / Qiagen N.V. | 0.04 | -37.91 | 1.86 | -27.03 | 4.5425 | 0.4084 | |||
| NTRA / Natera, Inc. | 0.01 | -51.57 | 1.86 | -50.90 | 4.5226 | -1.5950 | |||
| RNA / Avidity Biosciences, Inc. | 0.06 | -10.21 | 1.76 | -9.21 | 4.3013 | 1.1548 | |||
| MRNA / Moderna, Inc. | 0.07 | 22.07 | 1.75 | 4.73 | 4.2628 | 1.5593 | |||
| TECH / Bio-Techne Corporation | 0.03 | -16.15 | 1.69 | -34.31 | 4.1101 | -0.0430 | |||
| CRSP / CRISPR Therapeutics AG | 0.05 | -27.58 | 1.65 | -40.16 | 4.0109 | -0.4407 | |||
| BMRN / BioMarin Pharmaceutical Inc. | 0.03 | -31.44 | 1.64 | -44.04 | 3.9935 | -0.7468 | |||
| RARE / Ultragenyx Pharmaceutical Inc. | 0.05 | -11.06 | 1.59 | -29.48 | 3.8852 | 0.2263 | |||
| VRTX / Vertex Pharmaceuticals Incorporated | 0.00 | 16.98 | 1.57 | 7.77 | 3.8237 | 1.4676 | |||
| GH / Guardant Health, Inc. | 0.04 | 1.56 | 3.7911 | 3.7911 | |||||
| LEGN / Legend Biotech Corporation - Depositary Receipt (Common Stock) | 0.05 | -22.26 | 1.47 | -35.75 | 3.5953 | -0.1191 | |||
| BNTX / BioNTech SE - Depositary Receipt (Common Stock) | 0.02 | -41.36 | 1.46 | -50.26 | 3.5540 | -1.1898 | |||
| VCYT / Veracyte, Inc. | 0.04 | -50.43 | 1.17 | -62.07 | 2.8541 | -2.1410 | |||
| SRPT / Sarepta Therapeutics, Inc. | 0.03 | 32.42 | 1.10 | -53.36 | 2.6922 | -1.1413 | |||
| ARWR / Arrowhead Pharmaceuticals, Inc. | 0.07 | -54.90 | 1.05 | -61.70 | 2.5548 | -1.8721 | |||
| 1548 / Genscript Biotech Corporation | 0.64 | -55.46 | 1.04 | -55.52 | 2.5355 | -1.2473 | |||
| WGS / GeneDx Holdings Corp. | 0.01 | 1.01 | 2.4672 | 2.4672 | |||||
| TWST / Twist Bioscience Corporation | 0.03 | 0.94 | 2.3010 | 2.3010 | |||||
| A / Agilent Technologies, Inc. | 0.01 | -61.70 | 0.93 | -66.50 | 2.2634 | -2.2228 | |||
| AZN / Astrazeneca plc | 0.01 | 0.92 | 2.2338 | 2.2338 | |||||
| GILD / Gilead Sciences, Inc. | 0.01 | -50.41 | 0.90 | -52.25 | 2.1953 | -0.8577 | |||
| BMY / Bristol-Myers Squibb Company | 0.02 | 0.87 | 2.1145 | 2.1145 | |||||
| BEAM / Beam Therapeutics Inc. | 0.05 | -49.79 | 0.78 | -69.84 | 1.8935 | -2.2739 | |||
| LLY / Eli Lilly and Company | 0.00 | 0.78 | 1.8902 | 1.8902 | |||||
| TXG / 10x Genomics, Inc. | 0.06 | -57.18 | 0.55 | -61.85 | 1.3512 | -0.9998 | |||
| CDNA / CareDx, Inc | 0.03 | -56.16 | 0.50 | -66.38 | 1.2216 | -1.1910 | |||
| WVE / Wave Life Sciences Ltd. | 0.07 | 0.42 | 1.0248 | 1.0248 | |||||
| PRAX / Praxis Precision Medicines, Inc. | 0.01 | 0.41 | 1.0115 | 1.0115 | |||||
| QURE / uniQure N.V. | 0.03 | -54.00 | 0.41 | -49.38 | 0.9957 | -0.3106 | |||
| NTLA / Intellia Therapeutics, Inc. | 0.06 | -59.13 | 0.38 | -72.23 | 0.9313 | -1.2912 | |||
| VIR / Vir Biotechnology, Inc. | 0.05 | -58.26 | 0.25 | -75.50 | 0.6041 | -1.0281 | |||
| CVAC / CureVac N.V. | 0.05 | 67.94 | 0.24 | 6.70 | 0.5831 | 0.4757 | |||
| FLGT / Fulgent Genetics, Inc. | 0.01 | -57.93 | 0.23 | -43.61 | 0.5712 | -0.1012 | |||
| RGNX / REGENXBIO Inc. | 0.03 | -57.53 | 0.23 | -42.96 | 0.5553 | -0.0894 | |||
| STOK / Stoke Therapeutics, Inc. | 0.02 | 0.23 | 0.5518 | 0.5518 | |||||
| MYGN / Myriad Genetics, Inc. | 0.05 | -57.88 | 0.21 | -83.57 | 0.5126 | -1.5572 | |||
| ARCT / Arcturus Therapeutics Holdings Inc. | 0.01 | 0.17 | 0.4238 | 0.4238 | |||||
| VERV / Verve Therapeutics, Inc. | 0.04 | -55.58 | 0.17 | -68.77 | 0.4101 | -0.4621 | |||
| SANA / Sana Biotechnology, Inc. | 0.08 | -53.03 | 0.17 | -60.90 | 0.4025 | -0.2820 | |||
| PSNL / Personalis, Inc. | 0.04 | 0.16 | 0.3998 | 0.3998 | |||||
| MRVI / Maravai LifeSciences Holdings, Inc. | 0.07 | -58.48 | 0.15 | -71.07 | 0.3648 | -0.4702 | |||
| PACB / Pacific Biosciences of California, Inc. | 0.15 | -57.47 | 0.14 | -71.87 | 0.3531 | -0.4765 | |||
| RCKT / Rocket Pharmaceuticals, Inc. | 0.06 | -50.58 | 0.14 | -86.93 | 0.3456 | -1.4028 | |||
| CRGX / CARGO Therapeutics, Inc. | 0.03 | 0.12 | 0.2958 | 0.2958 | |||||
| ALLO / Allogene Therapeutics, Inc. | 0.08 | -56.10 | 0.09 | -73.74 | 0.2300 | -0.3499 | |||
| PRME / Prime Medicine, Inc. | 0.07 | 0.09 | 0.2097 | 0.2097 | |||||
| SGMO / Sangamo Therapeutics, Inc. | 0.17 | -34.88 | 0.08 | -70.37 | 0.1955 | -0.2418 | |||
| TSVT / 2seventy bio, Inc. | 0.00 | -100.00 | 0.00 | -100.00 | -0.2733 | ||||
| EDIT / Editas Medicine, Inc. | 0.00 | -100.00 | 0.00 | -100.00 | -0.3370 | ||||
| CRBU / Caribou Biosciences, Inc. | 0.00 | -100.00 | 0.00 | -100.00 | -0.2072 | ||||
| LYEL / Lyell Immunopharma, Inc. | 0.00 | -100.00 | 0.00 | -100.00 | -0.2097 |