Basic Stats
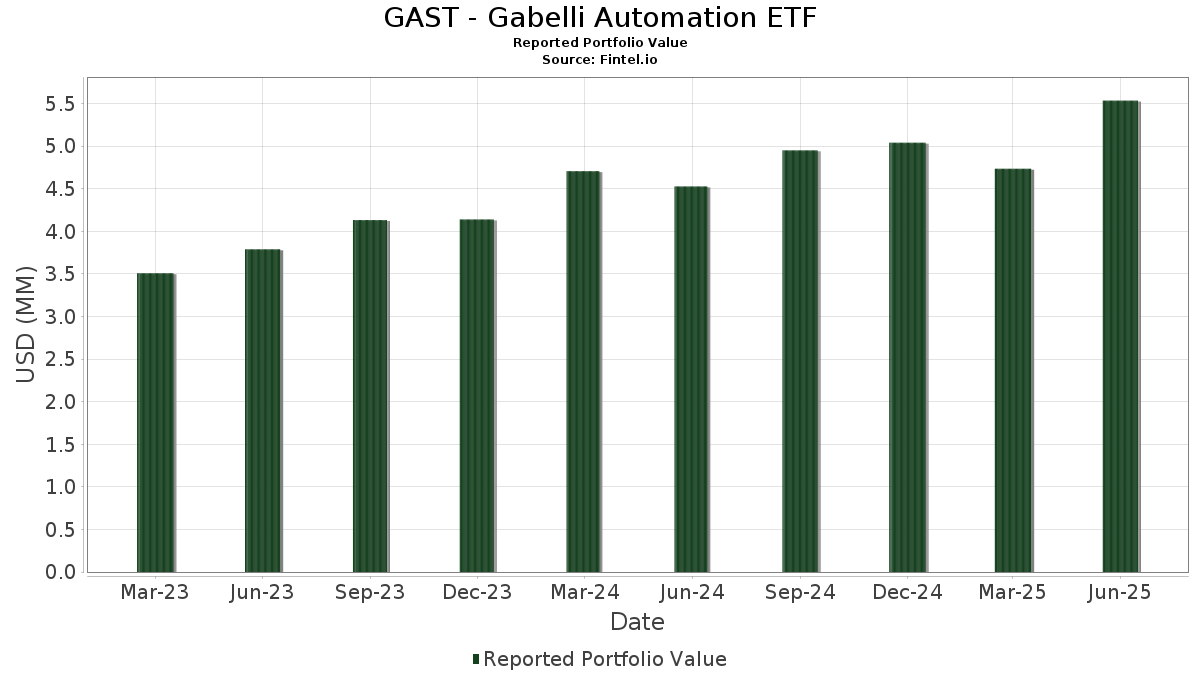
| Portfolio Value | $ 5,535,785 |
| Current Positions | 48 |
Latest Holdings, Performance, AUM (from 13F, 13D)
GAST - Gabelli Automation ETF has disclosed 48 total holdings in their latest SEC filings. Most recent portfolio value is calculated to be $ 5,535,785 USD. Actual Assets Under Management (AUM) is this value plus cash (which is not disclosed). GAST - Gabelli Automation ETF’s top holdings are Emerson Electric Co. (US:EMR) , Rockwell Automation, Inc. (US:ROK) , Check Point Software Technologies Ltd. (US:CHKP) , AZZ Inc. (US:AZZ) , and Allient Inc. (US:ALNT) . GAST - Gabelli Automation ETF’s new positions include RXO, Inc. (US:RXO) , Ralliant Corporation (US:RAL) , .
Top Increases This Quarter
We use the change in the portfolio allocation because this is the most meaningful metric. Changes can be due to trades or changes in share prices.
| Security | Shares (MM) |
Value (MM$) |
Portfolio % | ΔPortfolio % |
|---|---|---|---|---|
| 0.01 | 0.08 | 1.3500 | 1.3500 | |
| 0.01 | 0.22 | 3.7413 | 1.1642 | |
| 0.00 | 0.29 | 4.9180 | 1.0699 | |
| 0.00 | 0.19 | 3.2069 | 0.8733 | |
| 0.00 | 0.10 | 1.6613 | 0.6131 | |
| 0.00 | 0.12 | 2.0912 | 0.4826 | |
| 0.00 | 0.17 | 2.9044 | 0.4312 | |
| 0.00 | 0.02 | 0.3728 | 0.3728 | |
| 0.00 | 0.29 | 5.0153 | 0.3223 | |
| 0.00 | 0.13 | 2.2586 | 0.3092 |
Top Decreases This Quarter
We use the change in the portfolio allocation because this is the most meaningful metric. Changes can be due to trades or changes in share prices.
| Security | Shares (MM) |
Value (MM$) |
Portfolio % | ΔPortfolio % |
|---|---|---|---|---|
| 0.00 | 0.07 | 1.2025 | -0.7184 | |
| 0.00 | 0.24 | 4.1612 | -0.7167 | |
| 0.00 | 0.07 | 1.2399 | -0.6648 | |
| 0.00 | 0.18 | 3.1048 | -0.3645 | |
| 0.00 | 0.22 | 3.7112 | -0.3060 | |
| 0.00 | 0.08 | 1.4335 | -0.2835 | |
| 0.00 | 0.09 | 1.5970 | -0.2735 | |
| 0.00 | 0.09 | 1.5630 | -0.2584 | |
| 0.00 | 0.21 | 3.5294 | -0.2466 | |
| 0.00 | 0.04 | 0.6631 | -0.2235 |
13F and Fund Filings
This form was filed on 2025-08-29 for the reporting period 2025-06-30. Click the link icon to see the full transaction history.
Upgrade to unlock premium data and export to Excel ![]() .
.
| Security | Type | Avg Share Price | Shares (MM) |
ΔShares (%) |
ΔShares (%) |
Value ($MM) |
Portfolio (%) |
ΔPortfolio (%) |
|
|---|---|---|---|---|---|---|---|---|---|
| EMR / Emerson Electric Co. | 0.00 | 0.00 | 0.29 | 21.25 | 5.0153 | 0.3223 | |||
| ROK / Rockwell Automation, Inc. | 0.00 | 13.12 | 0.29 | 45.92 | 4.9180 | 1.0699 | |||
| CHKP / Check Point Software Technologies Ltd. | 0.00 | 0.00 | 0.24 | -2.81 | 4.1612 | -0.7167 | |||
| AZZ / AZZ Inc. | 0.00 | 0.00 | 0.24 | 13.08 | 4.1592 | -0.0291 | |||
| ALNT / Allient Inc. | 0.01 | 0.00 | 0.22 | 65.65 | 3.7413 | 1.1642 | |||
| AME / AMETEK, Inc. | 0.00 | 0.00 | 0.22 | 5.37 | 3.7112 | -0.3060 | |||
| ICE / Intercontinental Exchange, Inc. | 0.00 | 0.00 | 0.21 | 6.22 | 3.5294 | -0.2466 | |||
| ITT / ITT Inc. | 0.00 | 0.00 | 0.19 | 22.08 | 3.2298 | 0.2030 | |||
| ORCL / Oracle Corporation | 0.00 | 0.00 | 0.19 | 56.30 | 3.2069 | 0.8733 | |||
| RSG / Republic Services, Inc. | 0.00 | 0.00 | 0.18 | 1.69 | 3.1048 | -0.3645 | |||
| KD / Kyndryl Holdings, Inc. | 0.00 | 0.00 | 0.17 | 34.13 | 2.9044 | 0.4312 | |||
| GOOGL / Alphabet Inc. | 0.00 | 0.00 | 0.15 | 14.07 | 2.6516 | 0.0039 | |||
| REZI / Resideo Technologies, Inc. | 0.01 | 0.00 | 0.15 | 25.41 | 2.6288 | 0.2287 | |||
| GWW / W.W. Grainger, Inc. | 0.00 | 0.00 | 0.15 | 4.93 | 2.5729 | -0.2073 | |||
| FSTR / L.B. Foster Company | 0.01 | 0.00 | 0.14 | 11.11 | 2.4146 | -0.0579 | |||
| BDC / Belden Inc. | 0.00 | 0.00 | 0.14 | 15.00 | 2.3868 | 0.0355 | |||
| TYIA / Johnson Controls International plc | 0.00 | 0.00 | 0.13 | 32.32 | 2.2586 | 0.3092 | |||
| NEM / Newmont Corporation | 0.00 | 0.00 | 0.12 | 20.59 | 2.1204 | 0.1209 | |||
| GXO / GXO Logistics, Inc. | 0.00 | 18.71 | 0.12 | 47.56 | 2.0912 | 0.4826 | |||
| AZEK / The AZEK Company Inc. | 0.00 | 0.00 | 0.12 | 11.32 | 2.0304 | -0.0479 | |||
| MRCY / Mercury Systems, Inc. | 0.00 | 0.00 | 0.12 | 25.00 | 1.9816 | 0.1776 | |||
| AEM / Agnico Eagle Mines Limited | 0.00 | 0.00 | 0.11 | 10.00 | 1.8977 | -0.0707 | |||
| AMZN / Amazon.com, Inc. | 0.00 | 0.00 | 0.11 | 14.89 | 1.8690 | 0.0246 | |||
| PTC / PTC Inc. | 0.00 | 0.00 | 0.11 | 11.58 | 1.8293 | -0.0423 | |||
| B / Barrick Mining Corporation | 0.00 | 0.00 | 0.10 | 6.38 | 1.7347 | -0.1084 | |||
| FLS / Flowserve Corporation | 0.00 | 0.00 | 0.10 | 7.69 | 1.6913 | -0.1042 | |||
| CCJ / Cameco Corporation | 0.00 | 0.00 | 0.10 | 81.13 | 1.6613 | 0.6131 | |||
| TNC / Tennant Company | 0.00 | 0.00 | 0.09 | -3.16 | 1.5970 | -0.2735 | |||
| NOC / Northrop Grumman Corporation | 0.00 | 0.00 | 0.09 | -3.23 | 1.5630 | -0.2584 | |||
| KE / Kimball Electronics, Inc. | 0.00 | 0.00 | 0.08 | 16.67 | 1.4523 | 0.0386 | |||
| OII / Oceaneering International, Inc. | 0.00 | 0.00 | 0.08 | -4.60 | 1.4335 | -0.2835 | |||
| RXO / RXO, Inc. | 0.01 | 0.08 | 1.3500 | 1.3500 | |||||
| MATW / Matthews International Corporation | 0.00 | 0.00 | 0.07 | 7.46 | 1.2517 | -0.0732 | |||
| SPB / Spectrum Brands Holdings, Inc. | 0.00 | 0.00 | 0.07 | -25.77 | 1.2399 | -0.6648 | |||
| FTV / Fortive Corporation | 0.00 | 0.00 | 0.07 | -28.57 | 1.2025 | -0.7184 | |||
| TXN / Texas Instruments Incorporated | 0.00 | 0.00 | 0.07 | 16.07 | 1.1269 | 0.0170 | |||
| NABL / N-able, Inc. | 0.01 | 0.00 | 0.05 | 14.89 | 0.9333 | 0.0037 | |||
| PRLB / Proto Labs, Inc. | 0.00 | 0.00 | 0.05 | 12.20 | 0.8053 | 0.0034 | |||
| NDAQ / Nasdaq, Inc. | 0.00 | 0.00 | 0.04 | 16.67 | 0.7372 | 0.0255 | |||
| NATL / NCR Atleos Corporation | 0.00 | 0.00 | 0.04 | 8.11 | 0.6998 | -0.0365 | |||
| OXY / Occidental Petroleum Corporation | 0.00 | 0.00 | 0.04 | -15.56 | 0.6631 | -0.2235 | |||
| RES / RPC, Inc. | 0.01 | 0.00 | 0.04 | -13.64 | 0.6623 | -0.2140 | |||
| GFS / GLOBALFOUNDRIES Inc. | 0.00 | 0.00 | 0.04 | 5.56 | 0.6561 | -0.0653 | |||
| VYX / NCR Voyix Corporation | 0.00 | 0.00 | 0.03 | 22.22 | 0.5758 | 0.0312 | |||
| ACLS / Axcelis Technologies, Inc. | 0.00 | 0.00 | 0.03 | 45.00 | 0.5051 | 0.0955 | |||
| HAL / Halliburton Company | 0.00 | 0.00 | 0.03 | -19.35 | 0.4351 | -0.1812 | |||
| RAL / Ralliant Corporation | 0.00 | 0.02 | 0.3728 | 0.3728 | |||||
| DDD / 3D Systems Corporation | 0.01 | 0.00 | 0.02 | -28.00 | 0.3184 | -0.1804 |