Basic Stats
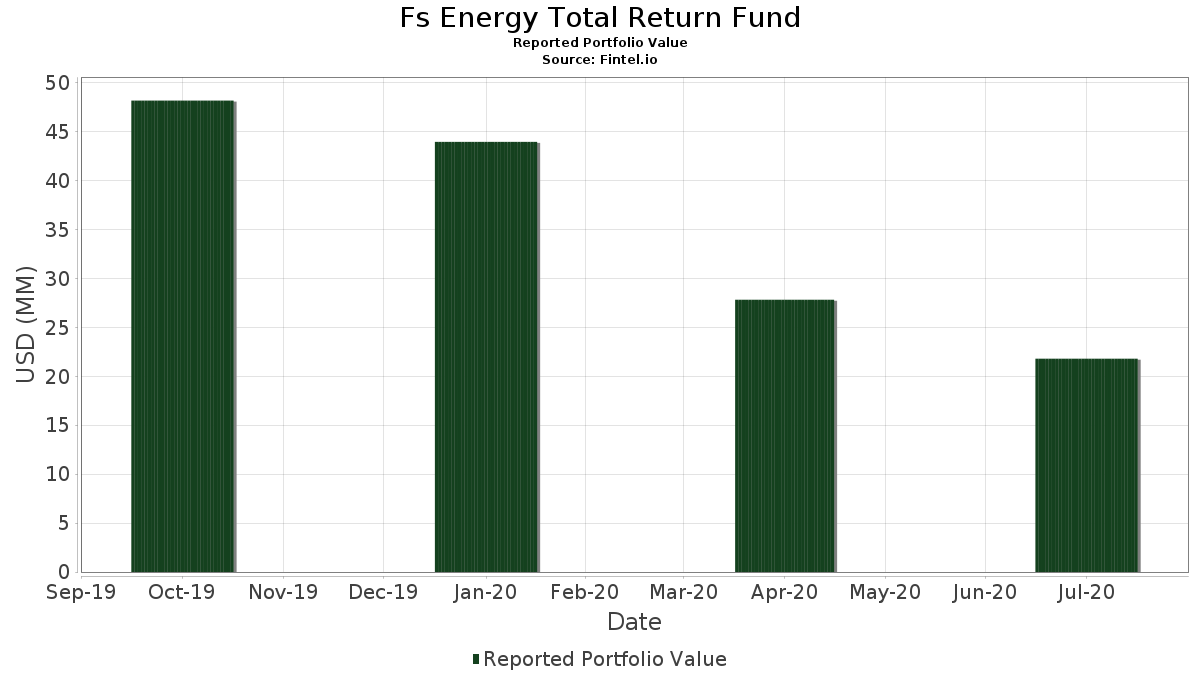
| Portfolio Value | $ 21,795,174 |
| Current Positions | 21 |
Latest Holdings, Performance, AUM (from 13F, 13D)
Fs Energy Total Return Fund has disclosed 21 total holdings in their latest SEC filings. Most recent portfolio value is calculated to be $ 21,795,174 USD. Actual Assets Under Management (AUM) is this value plus cash (which is not disclosed). Fs Energy Total Return Fund’s top holdings are Enterprise Products Partners L.P. - Limited Partnership (US:EPD) , Navitas Midstream Midland Basin, LLC, Term Loan (US:US63939UAE73) , Kinder Morgan, Inc. (US:KMI) , Exacttarget, Inc. (US:30064K105) , and MPLX LP - Limited Partnership (US:MPLX) . Fs Energy Total Return Fund’s new positions include Navitas Midstream Midland Basin, LLC, Term Loan (US:US63939UAE73) , Equitrans Midstream Corporation (US:ETRN) , BCP Raptor II, LLC 1st Lien Term Loan (US:US05550DAB01) , MOSS CREEK RESOURCES HLD (US:US61965RAB15) , and PG&E Corp. - Units (US:PCGU) .
Top Increases This Quarter
We use the change in the portfolio allocation because this is the most meaningful metric. Changes can be due to trades or changes in share prices.
| Security | Shares (MM) |
Value (MM$) |
Portfolio % | ΔPortfolio % |
|---|---|---|---|---|
| 0.11 | 1.04 | 4.7553 | 4.7553 | |
| 0.11 | 1.99 | 9.1030 | 4.6928 | |
| 0.03 | 0.98 | 4.4596 | 4.4596 | |
| 0.01 | 0.87 | 3.9850 | 3.9850 | |
| 1.79 | 8.1822 | 3.7908 | ||
| 0.01 | 0.70 | 3.1877 | 3.1877 | |
| 0.04 | 0.60 | 2.7278 | 2.7278 | |
| 0.09 | 1.56 | 7.1122 | 2.5016 | |
| 0.97 | 4.4123 | 2.2251 | ||
| 0.71 | 3.2383 | 1.3788 |
Top Decreases This Quarter
We use the change in the portfolio allocation because this is the most meaningful metric. Changes can be due to trades or changes in share prices.
| Security | Shares (MM) |
Value (MM$) |
Portfolio % | ΔPortfolio % |
|---|---|---|---|---|
| 0.24 | 1.56 | 7.1302 | -5.0291 | |
| 0.07 | 1.35 | 6.1534 | -5.0109 | |
| 0.02 | 0.71 | 3.2532 | -2.7838 | |
| 0.12 | 0.98 | 4.4913 | -1.8807 | |
| 0.13 | 1.78 | 8.1142 | -1.6556 | |
| 0.02 | 0.68 | 3.1084 | -0.9685 | |
| 0.02 | 0.43 | 1.9702 | -0.1279 | |
| 0.09 | 0.72 | 3.2902 | -0.0087 |
13F and Fund Filings
This form was filed on 2020-09-24 for the reporting period 2020-07-31. Click the link icon to see the full transaction history.
Upgrade to unlock premium data and export to Excel ![]() .
.
| Security | Type | Avg Share Price | Shares (MM) |
ΔShares (%) |
ΔShares (%) |
Value ($MM) |
Portfolio (%) |
ΔPortfolio (%) |
|
|---|---|---|---|---|---|---|---|---|---|
| EPD / Enterprise Products Partners L.P. - Limited Partnership | 0.11 | 61.25 | 1.99 | 61.69 | 9.1030 | 4.6928 | |||
| US63939UAE73 / Navitas Midstream Midland Basin, LLC, Term Loan | 1.79 | 45.88 | 8.1822 | 3.7908 | |||||
| KMI / Kinder Morgan, Inc. | 0.13 | -29.75 | 1.78 | -34.98 | 8.1142 | -1.6556 | |||
| 30064K105 / Exacttarget, Inc. | 0.24 | -41.11 | 1.56 | -54.09 | 7.1302 | -5.0291 | |||
| MPLX / MPLX LP - Limited Partnership | 0.09 | 19.66 | 1.56 | 20.81 | 7.1122 | 2.5016 | |||
| WMB / The Williams Companies, Inc. | 0.07 | -56.30 | 1.35 | -56.86 | 6.1534 | -5.0109 | |||
| ETRN / Equitrans Midstream Corporation | 0.11 | 1.04 | 4.7553 | 4.7553 | |||||
| US05550DAB01 / BCP Raptor II, LLC 1st Lien Term Loan | 1.02 | -0.10 | 4.6606 | 1.0068 | |||||
| PAGP / Plains GP Holdings, L.P. - Limited Partnership | 0.12 | -36.12 | 0.98 | -44.86 | 4.4913 | -1.8807 | |||
| CNP / CenterPoint Energy, Inc. | 0.03 | 25.00 | 0.98 | 33.70 | 4.4596 | 4.4596 | |||
| US61965RAB15 / MOSS CREEK RESOURCES HLD | 0.97 | 57.94 | 4.4123 | 2.2251 | |||||
| PCGU / PG&E Corp. - Units | 0.01 | 0.87 | 3.9850 | 3.9850 | |||||
| RTLR / Rattler Midstream Lp - Unit | 0.09 | -32.32 | 0.72 | -21.91 | 3.2902 | -0.0087 | |||
| ENB / Enbridge Inc. | 0.02 | -59.55 | 0.71 | -57.79 | 3.2532 | -2.7838 | |||
| US48253LAA44 / KLX Energy Services Holdings Inc | 0.71 | 36.42 | 3.2383 | 1.3788 | |||||
| LNG / Cheniere Energy, Inc. | 0.01 | 0.70 | 3.1877 | 3.1877 | |||||
| PPL / Pembina Pipeline Corporation | 0.03 | 12.80 | 0.69 | 19.55 | 3.1311 | 1.0800 | |||
| NPIFF / Northland Power Inc. | 0.02 | -30.83 | 0.68 | -11.66 | 3.1172 | 0.3533 | |||
| AY / Atlantica Sustainable Infrastructure plc | 0.02 | -52.31 | 0.68 | -40.30 | 3.1084 | -0.9685 | |||
| AES / The AES Corporation | 0.04 | 0.60 | 2.7278 | 2.7278 | |||||
| US92854Q1067 / Vivint Solar Inc. | 0.02 | -77.08 | 0.43 | -26.45 | 1.9702 | -0.1279 |