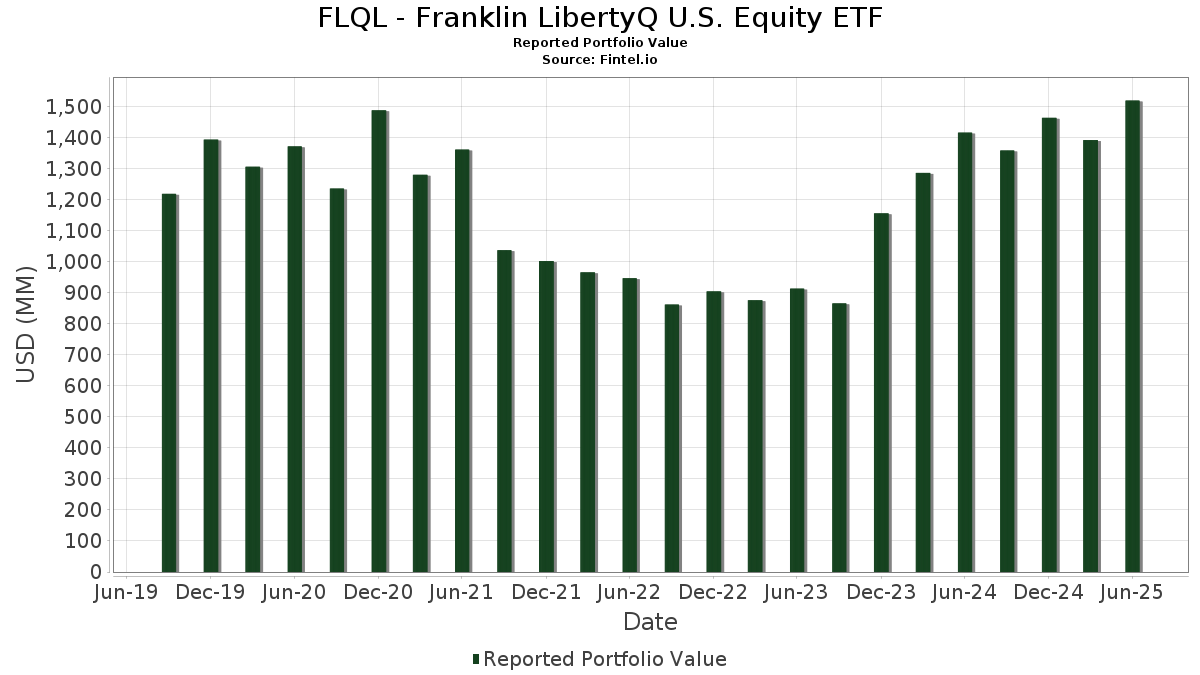
Basic Stats
| Portfolio Value | $ 1,518,610,501 |
| Current Positions | 215 |
Latest Holdings, Performance, AUM (from 13F, 13D)
FLQL - Franklin LibertyQ U.S. Equity ETF has disclosed 215 total holdings in their latest SEC filings. Most recent portfolio value is calculated to be $ 1,518,610,501 USD. Actual Assets Under Management (AUM) is this value plus cash (which is not disclosed). FLQL - Franklin LibertyQ U.S. Equity ETF’s top holdings are Microsoft Corporation (US:MSFT) , NVIDIA Corporation (US:NVDA) , Apple Inc. (US:AAPL) , Meta Platforms, Inc. (US:META) , and Amazon.com, Inc. (US:AMZN) . FLQL - Franklin LibertyQ U.S. Equity ETF’s new positions include CME Group Inc. (US:CME) , Robinhood Markets, Inc. (US:HOOD) , Johnson Controls International plc (DE:TYIA) , Roblox Corporation (US:RBLX) , and Cloudflare, Inc. (US:NET) .
Top Increases This Quarter
We use the change in the portfolio allocation because this is the most meaningful metric. Changes can be due to trades or changes in share prices.
| Security | Shares (MM) |
Value (MM$) |
Portfolio % | ΔPortfolio % |
|---|---|---|---|---|
| 0.20 | 97.85 | 6.4442 | 1.3505 | |
| 0.62 | 97.80 | 6.4408 | 1.1150 | |
| 0.14 | 38.09 | 2.5084 | 0.8828 | |
| 0.02 | 25.76 | 1.6967 | 0.6440 | |
| 0.08 | 7.58 | 0.4995 | 0.4995 | |
| 0.16 | 21.77 | 1.4336 | 0.4678 | |
| 0.07 | 48.64 | 3.2030 | 0.4260 | |
| 0.02 | 6.29 | 0.4142 | 0.4142 | |
| 0.02 | 4.64 | 0.3056 | 0.3056 | |
| 5.02 | 5.02 | 0.3307 | 0.2735 |
Top Decreases This Quarter
We use the change in the portfolio allocation because this is the most meaningful metric. Changes can be due to trades or changes in share prices.
| Security | Shares (MM) |
Value (MM$) |
Portfolio % | ΔPortfolio % |
|---|---|---|---|---|
| 0.43 | 87.73 | 5.7776 | -1.6121 | |
| 0.02 | 6.18 | 0.4068 | -0.8226 | |
| 0.03 | 8.99 | 0.5923 | -0.7664 | |
| 0.01 | 5.17 | 0.3405 | -0.5114 | |
| 0.05 | 5.04 | 0.3319 | -0.4462 | |
| 0.00 | 0.00 | -0.4175 | ||
| 0.01 | 4.00 | 0.2633 | -0.3421 | |
| 0.00 | 2.69 | 0.1772 | -0.3319 | |
| 0.12 | 22.05 | 1.4523 | -0.2698 | |
| 0.15 | 22.85 | 1.5048 | -0.2696 |
13F and Fund Filings
This form was filed on 2025-08-26 for the reporting period 2025-06-30. Click the link icon to see the full transaction history.
Upgrade to unlock premium data and export to Excel ![]() .
.
| Security | Type | Avg Share Price | Shares (MM) |
ΔShares (%) |
ΔShares (%) |
Value ($MM) |
Portfolio (%) |
ΔPortfolio (%) |
|
|---|---|---|---|---|---|---|---|---|---|
| MSFT / Microsoft Corporation | 0.20 | 4.19 | 97.85 | 38.06 | 6.4442 | 1.3505 | |||
| NVDA / NVIDIA Corporation | 0.62 | -9.47 | 97.80 | 31.97 | 6.4408 | 1.1150 | |||
| AAPL / Apple Inc. | 0.43 | -7.63 | 87.73 | -14.68 | 5.7776 | -1.6121 | |||
| META / Meta Platforms, Inc. | 0.07 | -1.72 | 48.64 | 25.86 | 3.2030 | 0.4260 | |||
| AMZN / Amazon.com, Inc. | 0.22 | -2.65 | 47.80 | 12.26 | 3.1481 | 0.0878 | |||
| AVGO / Broadcom Inc. | 0.14 | 2.28 | 38.09 | 68.39 | 2.5084 | 0.8828 | |||
| GOOGL / Alphabet Inc. | 0.16 | -3.29 | 28.57 | 10.21 | 1.8812 | 0.0185 | |||
| NFLX / Netflix, Inc. | 0.02 | -20.43 | 25.76 | 182.19 | 1.6967 | 0.6440 | |||
| MA / Mastercard Incorporated | 0.04 | -3.48 | 24.87 | -1.05 | 1.6376 | -0.1684 | |||
| WMT / Walmart Inc. | 0.25 | -2.99 | 24.41 | 8.04 | 1.6075 | -0.0161 | |||
| COST / Costco Wholesale Corporation | 0.02 | -2.42 | 24.24 | 2.14 | 1.5963 | -0.1092 | |||
| GOOG / Alphabet Inc. | 0.13 | -4.16 | 23.63 | 8.81 | 1.5565 | -0.0044 | |||
| JNJ / Johnson & Johnson | 0.15 | 0.47 | 22.85 | -7.46 | 1.5048 | -0.2696 | |||
| IBM / International Business Machines Corporation | 0.08 | -4.23 | 22.69 | 13.53 | 1.4940 | 0.0580 | |||
| CSCO / Cisco Systems, Inc. | 0.33 | 15.48 | 22.59 | 29.83 | 1.4878 | 0.2373 | |||
| ABBV / AbbVie Inc. | 0.12 | 3.87 | 22.05 | -7.98 | 1.4523 | -0.2698 | |||
| PLTR / Palantir Technologies Inc. | 0.16 | 0.28 | 21.77 | 61.98 | 1.4336 | 0.4678 | |||
| PM / Philip Morris International Inc. | 0.12 | -12.26 | 21.11 | 0.67 | 1.3904 | -0.1168 | |||
| ABT / Abbott Laboratories | 0.15 | 19.08 | 20.28 | 22.10 | 1.3356 | 0.1419 | |||
| TSLA / Tesla, Inc. | 0.06 | 0.64 | 20.02 | 23.36 | 1.3181 | 0.1521 | |||
| BRK.B / Berkshire Hathaway Inc. | 0.04 | 7.70 | 19.86 | -1.77 | 1.3079 | -0.1450 | |||
| JPM / JPMorgan Chase & Co. | 0.07 | -3.12 | 19.80 | 14.50 | 1.3040 | 0.0613 | |||
| T / AT&T Inc. | 0.67 | -4.61 | 19.49 | -2.39 | 1.2834 | -0.1514 | |||
| BKNG / Booking Holdings Inc. | 0.00 | -6.57 | 18.76 | 17.41 | 1.2352 | 0.0871 | |||
| ISRG / Intuitive Surgical, Inc. | 0.03 | -6.62 | 17.51 | 2.46 | 1.1533 | -0.0750 | |||
| VZ / Verizon Communications Inc. | 0.39 | -1.11 | 17.05 | -5.66 | 1.1225 | -0.1759 | |||
| TXN / Texas Instruments Incorporated | 0.08 | -8.97 | 16.68 | 5.17 | 1.0983 | -0.0413 | |||
| QCOM / QUALCOMM Incorporated | 0.10 | -5.12 | 16.24 | -1.63 | 1.0695 | -0.1169 | |||
| CAT / Caterpillar Inc. | 0.04 | -8.87 | 15.87 | 7.27 | 1.0452 | -0.0180 | |||
| LLY / Eli Lilly and Company | 0.02 | -8.21 | 15.75 | -13.37 | 1.0371 | -0.2693 | |||
| BSX / Boston Scientific Corporation | 0.15 | -4.64 | 15.65 | 1.54 | 1.0309 | -0.0770 | |||
| C / Citigroup Inc. | 0.18 | -7.57 | 15.48 | 10.83 | 1.0192 | 0.0157 | |||
| V / Visa Inc. | 0.04 | 44.72 | 15.20 | 46.62 | 1.0009 | 0.2560 | |||
| TJX / The TJX Companies, Inc. | 0.10 | -5.95 | 12.71 | -4.64 | 0.8371 | -0.1209 | |||
| GILD / Gilead Sciences, Inc. | 0.11 | 14.47 | 12.64 | 13.26 | 0.8323 | 0.0304 | |||
| SYK / Stryker Corporation | 0.03 | -9.61 | 11.99 | -3.93 | 0.7895 | -0.1073 | |||
| MO / Altria Group, Inc. | 0.20 | -5.98 | 11.96 | -8.16 | 0.7874 | -0.1482 | |||
| APH / Amphenol Corporation | 0.12 | 1.37 | 11.40 | 52.62 | 0.7507 | 0.2139 | |||
| SPF / Spotify Technology S.A. | 0.01 | 8.41 | 11.07 | 51.24 | 0.7292 | 0.2030 | |||
| ADP / Automatic Data Processing, Inc. | 0.04 | 18.71 | 10.83 | 19.82 | 0.7131 | 0.0637 | |||
| TMUS / T-Mobile US, Inc. | 0.04 | -9.55 | 10.20 | -19.20 | 0.6717 | -0.2354 | |||
| ANET / Arista Networks Inc | 0.10 | -10.15 | 9.74 | 18.64 | 0.6417 | 0.0515 | |||
| MCD / McDonald's Corporation | 0.03 | -31.18 | 8.99 | -23.68 | 0.5923 | -0.7664 | |||
| INTU / Intuit Inc. | 0.01 | -38.02 | 8.71 | -25.73 | 0.5738 | -0.2546 | |||
| BMY / Bristol-Myers Squibb Company | 0.17 | 11.50 | 8.02 | -15.37 | 0.5279 | -0.1528 | |||
| MCO / Moody's Corporation | 0.02 | -2.43 | 7.96 | 5.08 | 0.5243 | -0.0201 | |||
| UBER / Uber Technologies, Inc. | 0.08 | 7.58 | 0.4995 | 0.4995 | |||||
| MMM / 3M Company | 0.05 | 11.66 | 7.54 | 15.75 | 0.4967 | 0.0284 | |||
| HWM / Howmet Aerospace Inc. | 0.04 | 2.44 | 7.52 | 46.99 | 0.4952 | 0.1276 | |||
| PH / Parker-Hannifin Corporation | 0.01 | -6.68 | 7.39 | 7.24 | 0.4867 | -0.0086 | |||
| CTAS / Cintas Corporation | 0.03 | -1.36 | 7.26 | 6.97 | 0.4780 | -0.0096 | |||
| MDT / Medtronic plc | 0.08 | 45.46 | 6.88 | 41.10 | 0.4528 | 0.1026 | |||
| COF / Capital One Financial Corporation | 0.03 | 92.26 | 6.86 | 128.15 | 0.4515 | 0.2356 | |||
| WELL / Welltower Inc. | 0.04 | 48.83 | 6.65 | 49.33 | 0.4383 | 0.1180 | |||
| RCL / Royal Caribbean Cruises Ltd. | 0.02 | 2.01 | 6.61 | 55.51 | 0.4356 | 0.1299 | |||
| FTNT / Fortinet, Inc. | 0.06 | 13.98 | 6.36 | 25.19 | 0.4186 | 0.0537 | |||
| PGR / The Progressive Corporation | 0.02 | 6.29 | 0.4142 | 0.4142 | |||||
| ORLY / O'Reilly Automotive, Inc. | 0.07 | 1,656.19 | 6.24 | 10.48 | 0.4111 | 0.0051 | |||
| AMGN / Amgen Inc. | 0.02 | -57.32 | 6.18 | -63.02 | 0.4068 | -0.8226 | |||
| ITW / Illinois Tool Works Inc. | 0.02 | 11.50 | 5.71 | 11.16 | 0.3759 | 0.0069 | |||
| AON / Aon plc | 0.02 | 14.99 | 5.66 | 2.78 | 0.3729 | -0.0230 | |||
| DASH / DoorDash, Inc. | 0.02 | 47.92 | 5.57 | 99.50 | 0.3670 | 0.1663 | |||
| BK / The Bank of New York Mellon Corporation | 0.06 | 11.24 | 5.35 | 20.84 | 0.3521 | 0.0342 | |||
| FAST / Fastenal Company | 0.12 | 92.88 | 5.19 | 4.45 | 0.3419 | -0.0153 | |||
| KLAC / KLA Corporation | 0.01 | -61.38 | 5.17 | -55.32 | 0.3405 | -0.5114 | |||
| LRCX / Lam Research Corporation | 0.05 | 299.69 | 5.04 | -52.33 | 0.3319 | -0.4462 | |||
| INFXX / Institutional Fiduciary Trust - Institutional Fiduciary Trust Money Market Portfolio | 5.02 | 530.64 | 5.02 | 530.78 | 0.3307 | 0.2735 | |||
| RSG / Republic Services, Inc. | 0.02 | 4.69 | 4.84 | 6.61 | 0.3185 | -0.0075 | |||
| CME / CME Group Inc. | 0.02 | 4.64 | 0.3056 | 0.3056 | |||||
| NEM / Newmont Corporation | 0.08 | 60.93 | 4.48 | 94.24 | 0.2953 | 0.1294 | |||
| GWW / W.W. Grainger, Inc. | 0.00 | -5.25 | 4.32 | -0.23 | 0.2843 | -0.0266 | |||
| O / Realty Income Corporation | 0.07 | 12.13 | 4.27 | 11.35 | 0.2810 | 0.0056 | |||
| GM / General Motors Company | 0.09 | -10.40 | 4.26 | -6.25 | 0.2806 | -0.0460 | |||
| EOG / EOG Resources, Inc. | 0.03 | 43.36 | 4.14 | 33.74 | 0.2728 | 0.0502 | |||
| TT / Trane Technologies plc | 0.01 | -61.92 | 4.00 | -54.91 | 0.2633 | -0.3421 | |||
| GLW / Corning Incorporated | 0.07 | -5.54 | 3.84 | 8.50 | 0.2532 | -0.0014 | |||
| KMB / Kimberly-Clark Corporation | 0.03 | 3.79 | 3.76 | -5.91 | 0.2476 | -0.0396 | |||
| CTSH / Cognizant Technology Solutions Corporation | 0.05 | -1.41 | 3.60 | 0.59 | 0.2373 | -0.0202 | |||
| KR / The Kroger Co. | 0.05 | 5.78 | 3.55 | 12.08 | 0.2340 | 0.0062 | |||
| PAYX / Paychex, Inc. | 0.02 | 54.22 | 3.43 | 45.44 | 0.2258 | 0.0563 | |||
| EBAY / eBay Inc. | 0.04 | -0.29 | 3.33 | 9.61 | 0.2193 | 0.0010 | |||
| ETR / Entergy Corporation | 0.04 | -4.79 | 3.24 | -7.43 | 0.2133 | -0.0381 | |||
| RMD / ResMed Inc. | 0.01 | -2.43 | 3.23 | 12.44 | 0.2125 | 0.0063 | |||
| HOOD / Robinhood Markets, Inc. | 0.03 | 3.20 | 0.2106 | 0.2106 | |||||
| VICI / VICI Properties Inc. | 0.10 | 9.56 | 3.15 | 9.49 | 0.2076 | 0.0007 | |||
| GRMN / Garmin Ltd. | 0.01 | -11.04 | 3.11 | -14.48 | 0.2050 | -0.0566 | |||
| CAH / Cardinal Health, Inc. | 0.02 | 61.20 | 3.07 | 96.54 | 0.2022 | 0.0900 | |||
| HCA / HCA Healthcare, Inc. | 0.01 | -61.52 | 2.95 | -50.89 | 0.1942 | -0.2158 | |||
| TYIA / Johnson Controls International plc | 0.03 | 2.90 | 0.1907 | 0.1907 | |||||
| SYF / Synchrony Financial | 0.04 | -9.62 | 2.82 | 13.92 | 0.1860 | 0.0079 | |||
| YUM / Yum! Brands, Inc. | 0.02 | 42.60 | 2.71 | 34.26 | 0.1784 | 0.0334 | |||
| NRG / NRG Energy, Inc. | 0.02 | 17.75 | 2.70 | 98.17 | 0.1780 | 0.0800 | |||
| AZO / AutoZone, Inc. | 0.00 | -61.19 | 2.69 | -42.22 | 0.1772 | -0.3319 | |||
| RBLX / Roblox Corporation | 0.02 | 2.58 | 0.1699 | 0.1699 | |||||
| NET / Cloudflare, Inc. | 0.01 | 2.45 | 0.1613 | 0.1613 | |||||
| HPE / Hewlett Packard Enterprise Company | 0.12 | -11.11 | 2.42 | 17.83 | 0.1594 | 0.0118 | |||
| LPLA / LPL Financial Holdings Inc. | 0.01 | 46.35 | 2.16 | 67.75 | 0.1425 | 0.0498 | |||
| UAL / United Airlines Holdings, Inc. | 0.03 | -0.66 | 2.14 | 14.53 | 0.1413 | 0.0067 | |||
| WSM / Williams-Sonoma, Inc. | 0.01 | -15.02 | 2.12 | -12.21 | 0.1397 | -0.0339 | |||
| HPQ / HP Inc. | 0.09 | -12.24 | 2.11 | -22.50 | 0.1387 | -0.0565 | |||
| NTAP / NetApp, Inc. | 0.02 | -13.04 | 2.10 | 5.47 | 0.1384 | -0.0048 | |||
| DRI / Darden Restaurants, Inc. | 0.01 | 30.09 | 2.10 | 36.46 | 0.1381 | 0.0277 | |||
| FIX / Comfort Systems USA, Inc. | 0.00 | -2.43 | 2.06 | 62.31 | 0.1359 | 0.0445 | |||
| EME / EMCOR Group, Inc. | 0.00 | -13.27 | 2.06 | 25.49 | 0.1355 | 0.0177 | |||
| IBKR / Interactive Brokers Group, Inc. | 0.04 | 279.99 | 1.97 | 27.14 | 0.1299 | 0.0184 | |||
| LII / Lennox International Inc. | 0.00 | -2.43 | 1.93 | -0.26 | 0.1271 | -0.0120 | |||
| DGX / Quest Diagnostics Incorporated | 0.01 | -2.43 | 1.90 | 3.54 | 0.1252 | -0.0067 | |||
| TPR / Tapestry, Inc. | 0.02 | -2.43 | 1.90 | 21.64 | 0.1252 | 0.0129 | |||
| K / Kellanova | 0.02 | -0.40 | 1.87 | -4.00 | 0.1234 | -0.0168 | |||
| FFIV / F5, Inc. | 0.01 | 5.70 | 1.84 | 16.83 | 0.1212 | 0.0080 | |||
| NTRS / Northern Trust Corporation | 0.01 | 4.53 | 1.83 | 34.39 | 0.1205 | 0.0226 | |||
| PODD / Insulet Corporation | 0.01 | 6.44 | 1.81 | 27.32 | 0.1194 | 0.0171 | |||
| MNST / Monster Beverage Corporation | 0.03 | -27.66 | 1.81 | -14.44 | 0.1191 | -0.1245 | |||
| IDXX / IDEXX Laboratories, Inc. | 0.00 | -58.74 | 1.81 | -54.59 | 0.1189 | -0.1618 | |||
| VEEV / Veeva Systems Inc. | 0.01 | -51.12 | 1.80 | -51.17 | 0.1186 | -0.2366 | |||
| ATO / Atmos Energy Corporation | 0.01 | 1.99 | 1.78 | 1.71 | 0.1174 | -0.0086 | |||
| THC / Tenet Healthcare Corporation | 0.01 | -14.63 | 1.78 | 11.69 | 0.1171 | 0.0027 | |||
| LH / Labcorp Holdings Inc. | 0.01 | 13.83 | 1.77 | 28.42 | 0.1164 | 0.0175 | |||
| DOCS / Doximity, Inc. | 0.03 | 25.75 | 1.71 | 32.94 | 0.1127 | 0.0202 | |||
| GWRE / Guidewire Software, Inc. | 0.01 | -2.43 | 1.70 | 22.60 | 0.1119 | 0.0123 | |||
| DVN / Devon Energy Corporation | 0.05 | 2.00 | 1.66 | -13.25 | 0.1096 | -0.0283 | |||
| STLD / Steel Dynamics, Inc. | 0.01 | -12.19 | 1.66 | -10.11 | 0.1095 | -0.0235 | |||
| NEU / NewMarket Corporation | 0.00 | -2.43 | 1.66 | 18.98 | 0.1094 | 0.0091 | |||
| ZS / Zscaler, Inc. | 0.01 | 1.66 | 0.1094 | 0.1094 | |||||
| COOP / Mr. Cooper Group Inc. | 0.01 | 1.65 | 0.1087 | 0.1087 | |||||
| CW / Curtiss-Wright Corporation | 0.00 | -15.85 | 1.64 | 15.86 | 0.1083 | 0.0114 | |||
| SSNC / SS&C Technologies Holdings, Inc. | 0.02 | -2.43 | 1.63 | -3.32 | 0.1075 | -0.0138 | |||
| SNX / TD SYNNEX Corporation | 0.01 | 10.87 | 1.63 | 44.72 | 0.1075 | 0.0264 | |||
| TOST / Toast, Inc. | 0.04 | -4.94 | 1.62 | 26.98 | 0.1066 | 0.0150 | |||
| SCCO / Southern Copper Corporation | 0.02 | -5.30 | 1.61 | 2.49 | 0.1058 | -0.0068 | |||
| LULU / lululemon athletica inc. | 0.01 | 36.59 | 1.60 | 14.62 | 0.1054 | 0.0051 | |||
| RPRX / Royalty Pharma plc | 0.04 | -0.27 | 1.59 | 15.42 | 0.1050 | 0.0057 | |||
| CF / CF Industries Holdings, Inc. | 0.02 | -5.07 | 1.59 | 11.79 | 0.1049 | 0.0025 | |||
| PEGA / Pegasystems Inc. | 0.03 | 1.59 | 0.1046 | 0.1046 | |||||
| UI / Ubiquiti Inc. | 0.00 | -13.27 | 1.58 | 15.12 | 0.1043 | 0.0054 | |||
| APA / APA Corporation | 0.09 | 18.28 | 1.56 | 2.98 | 0.1025 | -0.0062 | |||
| EQH / Equitable Holdings, Inc. | 0.03 | 2.00 | 1.55 | 9.84 | 0.1022 | 0.0007 | |||
| ROL / Rollins, Inc. | 0.03 | -4.12 | 1.55 | 0.13 | 0.1019 | -0.0092 | |||
| CUZ / Cousins Properties Incorporated | 0.05 | 4.40 | 1.55 | 6.26 | 0.1018 | -0.0027 | |||
| EXPE / Expedia Group, Inc. | 0.01 | 23.58 | 1.54 | 23.97 | 0.1015 | 0.0122 | |||
| TNL / Travel + Leisure Co. | 0.03 | 12.02 | 1.54 | 24.92 | 0.1014 | 0.0128 | |||
| KRC / Kilroy Realty Corporation | 0.04 | 8.02 | 1.53 | 13.13 | 0.1011 | 0.0036 | |||
| EHC / Encompass Health Corporation | 0.01 | -15.44 | 1.53 | 2.40 | 0.1010 | -0.0067 | |||
| DTM / DT Midstream, Inc. | 0.01 | -8.73 | 1.53 | 4.00 | 0.1010 | -0.0050 | |||
| R / Ryder System, Inc. | 0.01 | 8.41 | 1.53 | 19.83 | 0.1007 | 0.0090 | |||
| MTG / MGIC Investment Corporation | 0.05 | -9.57 | 1.53 | 1.60 | 0.1005 | -0.0075 | |||
| EXEL / Exelixis, Inc. | 0.03 | -9.94 | 1.53 | 7.54 | 0.1005 | -0.0015 | |||
| UNM / Unum Group | 0.02 | -7.19 | 1.51 | -8.02 | 0.0998 | -0.0186 | |||
| LNC / Lincoln National Corporation | 0.04 | 13.83 | 1.51 | 9.71 | 0.0997 | 0.0005 | |||
| EPR / EPR Properties | 0.03 | -7.57 | 1.51 | 2.37 | 0.0997 | -0.0066 | |||
| SEIC / SEI Investments Company | 0.02 | -10.14 | 1.51 | 3.99 | 0.0996 | -0.0049 | |||
| AU / AngloGold Ashanti plc | 0.03 | 1.51 | 0.0996 | 0.0996 | |||||
| WAT / Waters Corporation | 0.00 | -2.43 | 1.51 | -7.65 | 0.0995 | -0.0180 | |||
| HIW / Highwoods Properties, Inc. | 0.05 | -5.25 | 1.51 | -0.59 | 0.0995 | -0.0097 | |||
| MEDP / Medpace Holdings, Inc. | 0.00 | 8.41 | 1.51 | 11.70 | 0.0994 | 0.0023 | |||
| BYD / Boyd Gaming Corporation | 0.02 | 1.51 | 0.0991 | 0.0991 | |||||
| DVA / DaVita Inc. | 0.01 | 7.13 | 1.50 | -0.27 | 0.0991 | -0.0093 | |||
| OGN / Organon & Co. | 0.15 | 54.76 | 1.50 | 0.60 | 0.0987 | -0.0084 | |||
| DOCU / DocuSign, Inc. | 0.02 | -2.43 | 1.50 | -6.67 | 0.0987 | -0.0167 | |||
| TWLO / Twilio Inc. | 0.01 | -2.43 | 1.50 | 23.96 | 0.0985 | 0.0118 | |||
| NNN / NNN REIT, Inc. | 0.03 | -1.06 | 1.50 | 0.20 | 0.0985 | -0.0088 | |||
| EVRG / Evergy, Inc. | 0.02 | -2.43 | 1.49 | -2.49 | 0.0983 | -0.0117 | |||
| MLI / Mueller Industries, Inc. | 0.02 | 1.49 | 0.0982 | 0.0982 | |||||
| AWI / Armstrong World Industries, Inc. | 0.01 | -7.31 | 1.48 | 6.84 | 0.0978 | -0.0021 | |||
| FOXA / Fox Corporation | 0.03 | -2.43 | 1.48 | -3.39 | 0.0976 | -0.0127 | |||
| G / Genpact Limited | 0.03 | 19.82 | 1.48 | 4.66 | 0.0976 | -0.0042 | |||
| ADT / ADT Inc. | 0.17 | 1.47 | 0.0971 | 0.0971 | |||||
| NFG / National Fuel Gas Company | 0.02 | -12.19 | 1.47 | -6.09 | 0.0966 | -0.0156 | |||
| SLM / SLM Corporation | 0.04 | -29.26 | 1.47 | 11.57 | 0.0966 | 0.0038 | |||
| RITM / Rithm Capital Corp. | 0.13 | 5.79 | 1.47 | 4.34 | 0.0966 | -0.0045 | |||
| CROX / Crocs, Inc. | 0.01 | 54.50 | 1.46 | 8.06 | 0.0962 | -0.0033 | |||
| AM / Antero Midstream Corporation | 0.08 | -21.81 | 1.46 | 0.55 | 0.0960 | -0.0064 | |||
| MOS / The Mosaic Company | 0.04 | 1.46 | 0.0959 | 0.0959 | |||||
| ALLE / Allegion plc | 0.01 | 1.46 | 0.0959 | 0.0959 | |||||
| RGLD / Royal Gold, Inc. | 0.01 | -17.07 | 1.45 | -9.80 | 0.0958 | -0.0201 | |||
| UGI / UGI Corporation | 0.04 | -9.01 | 1.45 | 0.14 | 0.0958 | -0.0085 | |||
| FOX / Fox Corporation | 0.03 | 2.00 | 1.45 | -0.14 | 0.0957 | -0.0088 | |||
| BBY / Best Buy Co., Inc. | 0.02 | 9.76 | 1.45 | 0.14 | 0.0957 | -0.0086 | |||
| BJ / BJ's Wholesale Club Holdings, Inc. | 0.01 | -8.94 | 1.45 | -13.93 | 0.0956 | -0.0256 | |||
| RL / Ralph Lauren Corporation | 0.01 | -2.43 | 1.45 | 21.22 | 0.0956 | 0.0095 | |||
| AOS / Amdocs Limited | 0.02 | -5.30 | 1.45 | -5.54 | 0.0954 | -0.0148 | |||
| AXV / AXIS Capital Holdings Limited | 0.01 | -8.73 | 1.45 | -5.42 | 0.0954 | -0.0147 | |||
| WPC / W. P. Carey Inc. | 0.02 | 1.44 | 0.0948 | 0.0948 | |||||
| ULTA / Ulta Beauty, Inc. | 0.00 | 29.01 | 1.44 | 56.37 | 0.0947 | 0.0298 | |||
| INGR / Ingredion Incorporated | 0.01 | -6.68 | 1.44 | -6.39 | 0.0945 | -0.0157 | |||
| NTNX / Nutanix, Inc. | 0.02 | -12.42 | 1.43 | 17.75 | 0.0944 | 0.0084 | |||
| DBX / Dropbox, Inc. | 0.05 | 25.78 | 1.43 | 22.01 | 0.0942 | -0.0071 | |||
| OHI / Omega Healthcare Investors, Inc. | 0.04 | -3.62 | 1.43 | -7.28 | 0.0940 | -0.0166 | |||
| VMI / Valmont Industries, Inc. | 0.00 | -2.43 | 1.41 | 11.61 | 0.0931 | 0.0021 | |||
| WRB / W. R. Berkley Corporation | 0.02 | 1.41 | 0.0931 | 0.0931 | |||||
| GLPI / Gaming and Leisure Properties, Inc. | 0.03 | 2.00 | 1.41 | -6.45 | 0.0928 | -0.0154 | |||
| MPWR / Monolithic Power Systems, Inc. | 0.00 | -8.64 | 1.41 | -27.70 | 0.0927 | -0.0506 | |||
| ADC / Agree Realty Corporation | 0.02 | -7.08 | 1.41 | -12.08 | 0.0926 | -0.0223 | |||
| BR / Broadridge Financial Solutions, Inc. | 0.01 | -40.43 | 1.40 | -26.52 | 0.0924 | -0.0424 | |||
| BROS / Dutch Bros Inc. | 0.02 | 5.07 | 1.38 | 16.34 | 0.0910 | 0.0057 | |||
| DPZ / Domino's Pizza, Inc. | 0.00 | -11.42 | 1.38 | -13.12 | 0.0907 | -0.0232 | |||
| CORT / Corcept Therapeutics Incorporated | 0.02 | 1.38 | 0.0907 | 0.0907 | |||||
| CHWY / Chewy, Inc. | 0.03 | 1.37 | 0.0905 | 0.0905 | |||||
| CNXC / Concentrix Corporation | 0.03 | 130.18 | 1.37 | 51.94 | 0.0904 | -0.0138 | |||
| EXLS / ExlService Holdings, Inc. | 0.03 | 1.37 | 0.0902 | 0.0902 | |||||
| MPW / Medical Properties Trust, Inc. | 0.32 | 25.33 | 1.37 | -10.43 | 0.0900 | -0.0196 | |||
| LOPE / Grand Canyon Education, Inc. | 0.01 | -13.91 | 1.36 | -6.00 | 0.0898 | -0.0144 | |||
| TXRH / Texas Roadhouse, Inc. | 0.01 | -8.53 | 1.35 | 2.89 | 0.0890 | -0.0054 | |||
| HALO / Halozyme Therapeutics, Inc. | 0.03 | 1.35 | 0.0890 | 0.0890 | |||||
| SNA / Snap-on Incorporated | 0.00 | -2.43 | 1.35 | -9.90 | 0.0887 | -0.0187 | |||
| SFM / Sprouts Farmers Market, Inc. | 0.01 | -60.07 | 1.35 | 146.97 | 0.0887 | 0.0461 | |||
| PAYC / Paycom Software, Inc. | 0.01 | 1.34 | 0.0880 | 0.0880 | |||||
| ALSN / Allison Transmission Holdings, Inc. | 0.01 | -5.69 | 1.33 | -6.29 | 0.0873 | -0.0144 | |||
| PPC / Pilgrim's Pride Corporation | 0.03 | 6.28 | 1.32 | -12.30 | 0.0869 | -0.0212 | |||
| WU / The Western Union Company | 0.16 | 13.30 | 1.31 | -9.83 | 0.0864 | -0.0182 | |||
| FRHC / Freedom Holding Corp. | 0.01 | 1.26 | 0.0833 | 0.0833 | |||||
| UTHR / United Therapeutics Corporation | 0.00 | -2.43 | 1.24 | -9.07 | 0.0819 | -0.0164 | |||
| CHE / Chemed Corporation | 0.00 | 2.01 | 1.23 | -19.32 | 0.0812 | -0.0286 | |||
| DUOL / Duolingo, Inc. | 0.00 | 1.18 | 0.0779 | 0.0779 | |||||
| S+P500 EMINI FUT SEP25 / DE (000000000) | 0.09 | 0.0058 | 0.0058 | ||||||
| MS / Morgan Stanley | 0.00 | -100.00 | 0.00 | -100.00 | -0.4175 | ||||
| BERY / Berry Global Group, Inc. | 0.00 | -100.00 | 0.00 | -100.00 | -0.1039 | ||||
| MASI / Masimo Corporation | 0.00 | -100.00 | 0.00 | -100.00 | -0.0944 | ||||
| ITCI / Intra-Cellular Therapies, Inc. | 0.00 | -100.00 | 0.00 | -100.00 | -0.1122 | ||||
| MRP / Millrose Properties, Inc. | 0.00 | -100.00 | 0.00 | -100.00 | -0.1240 | ||||
| WH / Wyndham Hotels & Resorts, Inc. | 0.00 | -100.00 | 0.00 | -100.00 | -0.0898 |